
Ethereum and Altcoin Trends – September 24, 2025
Overview. The session on September 24, 2025 offered a useful snapshot of how large-cap platforms and mid-cap tokens can move together. Ethereum traded in a region that many chart readers treat as a potential accumulation band, while selected altcoins such as ASTER and HYPE showed stronger-than-average activity. This recap is written purely from an explanatory angle, aiming to clarify what observers mean when they talk about structure, momentum and breadth.
Nothing in this article is a signal to buy or sell any asset. It is intended to help readers understand market commentary, not to provide a trading plan.
1) Ethereum’s structure: what an accumulation zone usually implies
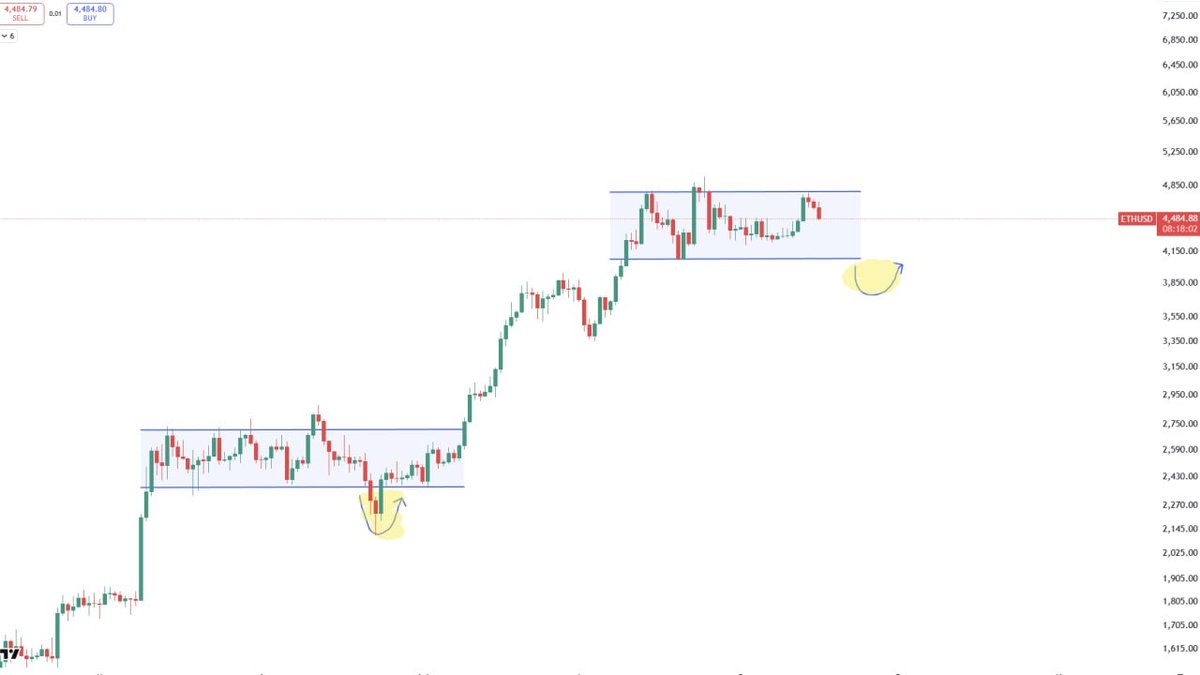
Across markets, analysts often describe price areas that repeatedly attract demand as potential accumulation zones. On September 24, Ethereum revisited a band that overlapped with common retracement measures and prior areas of interest on multi-hour and daily charts.
In educational terms, such a zone is noteworthy for three reasons:
- Historical interaction. When price has turned around the same area multiple times, it suggests that buyers and sellers previously disagreed strongly there, leaving behind a visible footprint.
- Time spent. Sideways trading inside a band can indicate that the market is digesting previous moves rather than immediately extending them.
- Reaction function. How price behaves when it returns to a familiar region can provide clues about whether market participants still view it as attractive or not.
Interpreting this behaviour does not guarantee any outcome. A zone that once coincided with accumulation can later fail. The key takeaway is simply that levels discussed by many participants can become focal points for sentiment and liquidity.
2) Altcoins ASTER and HYPE: examples of focused momentum
While Ethereum moved inside a relatively defined band, ASTER and HYPE stood out among mid-cap names. Both showed elevated trading interest compared with their recent history, along with active discussion on social channels and, in ASTER’s case, noticeable on-chain activity.
These types of moves highlight several general concepts:
- Leadership within a segment. It is common for only a handful of tokens in a sector to capture most of the short-term attention at any given time.
- Channel-like behaviour. Many trending assets trace out rising or falling price channels where advances are punctuated by pullbacks. Observing how those channels behave is often part of technical analysis.
- Information flow. Coverage by analysts, mentions from builders and changing liquidity conditions on exchanges can all feed into whether a name is perceived as gaining or losing momentum.
Understanding these patterns can help readers place day-to-day price action in context without inferring that any specific trajectory must continue.
3) Why the ETH and mid-cap combination matters for market breadth
The combination of Ethereum holding an important chart region and selected mid-caps showing strength is often interpreted as a sign that risk-taking is still present in the system. Conceptually, the logic is straightforward:
- If a major platform asset is stabilising, participants may feel more comfortable exploring opportunities in smaller names.
- Rising volume beyond the largest coins can indicate that liquidity is not concentrated solely in a few headlines.
- At the same time, narrow leadership reminds observers that conditions can change quickly if support for the larger base asset weakens.
These are descriptive, not prescriptive, points. They explain why some commentators pay attention to breadth across market capitalisation tiers.
4) Risk factors and sources of uncertainty
Any assessment of a single day must keep the bigger picture in mind. Some of the main open questions around the September 24 set-up include:
- Whether Ethereum can continue to hold key areas on multi-day closes if macro conditions or news flow turn less friendly.
- How stable activity in ASTER, HYPE and similar names remains if overall volume falls.
- To what extent derivatives positioning or funding conditions could amplify moves in either direction.
Educationally, the value lies in watching how these questions are resolved over subsequent sessions, not in assuming that one snapshot guarantees a particular trend.
5) Takeaways for readers following the market
For readers who are learning to interpret daily recaps, September 24 is a helpful example of how analysts link together structure in a major asset and behaviour in mid-cap tokens:
- Ethereum’s behaviour around a highlighted band illustrates how technical regions can become focal points for commentary.
- ASTER and HYPE show how only a few names may carry most of the relative strength inside a broader category.
- The interaction between the two offers a glimpse into the idea of market breadth and rotation.
This article is for informational and educational purposes only. It does not describe, recommend or endorse any trading strategy, position size or execution method. Digital assets are volatile and may be unsuitable for many investors. Always perform your own due diligence and consider speaking with a qualified professional before making financial decisions.


