Cosmos (ATOM) Price Forecast 2025 — Scenarios tied to IBC growth, ICS revenues and staking
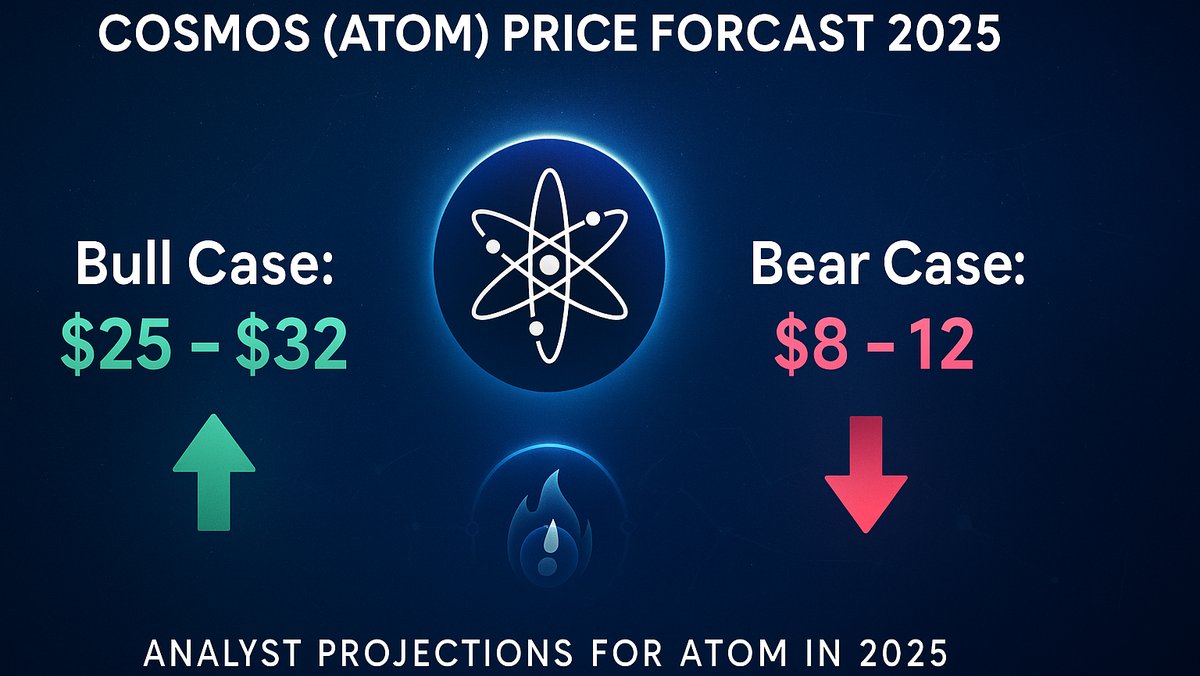
TL;DR: We frame ATOM’s 2025 outcomes with trackable drivers. Bear: $6–$10. Base: $14–$26. Bull: $30–$55. Which band wins depends on three needles: IBC network breadth and usage, Interchain Security (ICS) fee flows to Cosmos Hub, and ATOM staking that tightens float.
Why these drivers matter
- IBC network effects: More IBC-connected zones and higher cross-chain traffic increase utility for Cosmos assets and apps. Adoption is reflected in zone count, monthly IBC transfers and unique IBC addresses.
- ICS revenues to the Hub: Consumer chains secured by Cosmos Hub remit a share of fees or tokens back to the Hub, benefiting ATOM stakers. The more credible, revenue-generating consumers live on ICS, the stronger the fundamental link.
- Staking and liquid staking: A higher staked share reduces liquid float. Liquid staking (e.g., via Cosmos-native protocols) keeps capital usable while keeping supply locked, amplifying upside in risk-on phases.
Cosmos status baseline (directional, not gospel)
- IBC zones: Cosmos has grown from dozens of IBC-enabled chains to the low triple digits by late 2024. Treat 100+ zones as a reasonable ballpark and track whether that number accelerates in 2025.
- IBC activity: Monthly cross-chain transfers and active IBC addresses have shown multi-cycle growth with bursts during DeFi and airdrop seasons. Watch trend, not single prints.
- ATOM staking: Historically in the ~60–70% range of circulating supply staked on the Hub, fluctuating with yield and market conditions.
- ICS adoption: A small but growing set of consumer chains. The key is not logo count but fee remit and durability of usage.
Note: The exact numbers move daily. Use live dashboards to verify zone counts, IBC transfers and staking ratios before anchoring positions.
Price scenarios for 2025 with explicit assumptions
| Scenario | Price band | IBC and users | ICS and fees to Hub | Staking and float | Cycle context |
|---|---|---|---|---|---|
| Bear | $6–$10 | Zones ≤ ~100, IBC usage flat or volatile without trend | < ~5–10m USD annualized value to Hub from consumers | Staked share < ~58%, exchange balances rise | Risk-off, BTC dominance high, alt rotations short |
| Base | $14–$26 | Zones ~110–130, IBC transfers grow 25–50% YoY | ~10–25m USD annualized remit to Hub, 3–5 active consumers | Staked share ~60–70%, liquid staking penetration rises | Constructive market; L2 and app-chain activity improving |
| Bull | $30–$55 | Zones ≥ ~130–150, sustained growth in monthly IBC users and value settled | ≥ ~25–40m USD annualized remit to Hub from 5+ revenue consumers | Staked share ≥ ~68–72%, exchange balances trend down | Secular risk-on; DeFi and consumer apps scale on Cosmos |
How to use: assign probabilities to each scenario and update monthly. If ICS fees and IBC usage overshoot the base thresholds for two consecutive quarters, shift weight toward the bull band. If they undershoot, bias to bear.
‘If X then Y’ checkpoints you can track
- If IBC-connected zones pass ~130 and monthly cross-chain users keep growing double digits for two quarters, then ATOM fair range trends toward $22–$35 even without major tokenomics changes.
- If 5+ ICS consumer chains deliver a combined ≥ ~25m USD annualized value share to the Hub, then the market can justify $30–$55 provided staking stays ≥ ~68% and exchange balances fall.
- If staking sinks below ~58% and IBC growth stalls, then expect $6–$12 chop unless macro flips decisively risk-on.
How the thesis translates economically
- Usage proxy: Take IBC transfers per day and unique IBC addresses as a throughput signal for Cosmos apps and liquidity.
- Fee linkage: Add ICS remittances to Hub to approximate value flowing to ATOM stakers. Rising, recurring remits reduce the ‘pure narrative’ discount.
- Float effect: Higher staking and liquid staking reduce tradable supply. In uptrends, reduced float often magnifies price elasticity.
Illustrative price history and 2025 bands
My view for 2025
I lean to the base band $14–$26 with upside toward the low $30s if ICS remits become meaningful and IBC user growth re-accelerates in the second half. The cleanest bull path is fewer but larger consumer chains that send steady value to the Hub, plus sustained IBC traffic from a handful of breakout apps.
What could break the thesis
- Execution risk: ICS adoption lags or consumer chains under-deliver fees.
- Competitive pressure: Alternative L1s or L2s capture the next wave of app growth, capping IBC flow.
- Token supply shocks: Staking falls, liquid staking unwinds, or exchange balances rise into rallies.
- Macro: Tight liquidity or regulatory shocks compress multiples across infra tokens.
How to keep this forecast updated monthly
- Record IBC zone count and monthly cross-chain users.
- Aggregate ICS remits to the Hub (stable-value terms) and number of revenue-positive consumers.
- Track ATOM staking ratio and major exchange balances.
- Score each on a 0–2 scale and map to bands: 0–3 bear edge, 4–6 base, 7–8 bull bias.
FAQs
Does ATOM pay yield directly from ICS? ATOM stakers can receive value routed to the Hub by consumer chains per governance. Size and consistency of these remits are the key.
Why does staking matter to price? A higher staked share reduces liquid float. When demand rises, fewer coins available on exchanges can amplify moves.
What is the single best leading indicator? A tie between monthly IBC users and verified, recurring ICS remits. Both speak to durable demand rather than one-off events.
Disclaimer: Ranges are illustrative and not investment advice. Always verify current IBC, staking and ICS figures before acting.

