Chainlink (LINK) Price Prediction 2025 — A Scenario Model Anchored to Real Usage
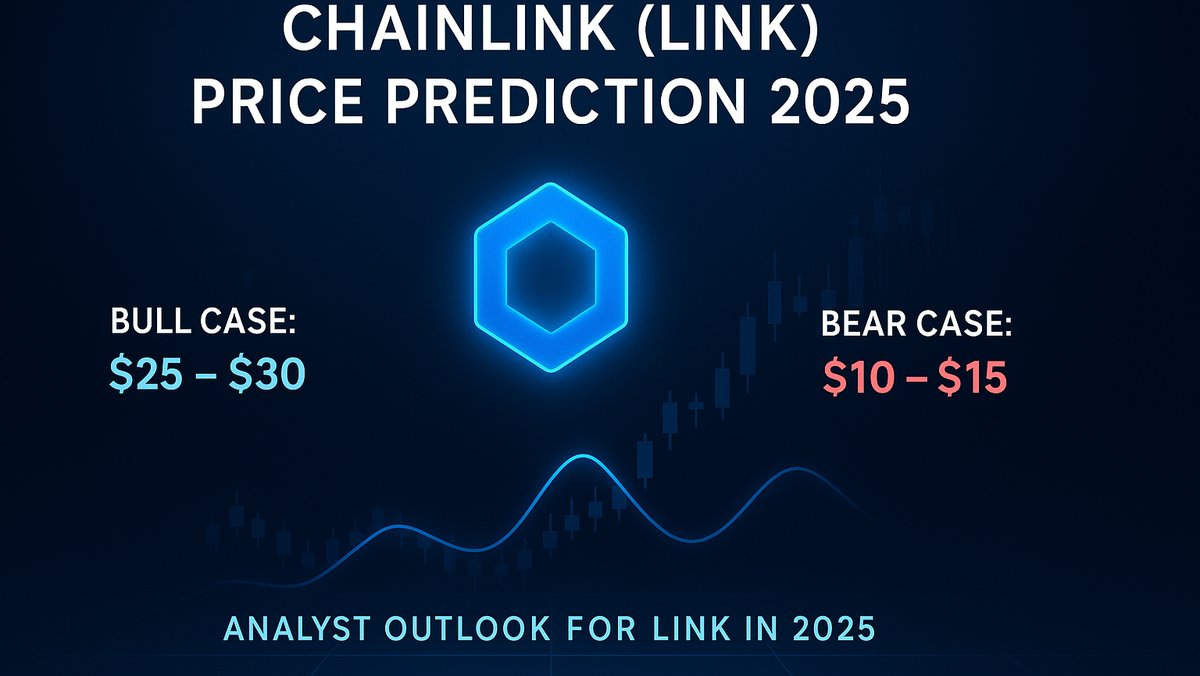
TL;DR: We forecast three explicit scenarios for LINK in 2025, grounded in drivers we can actually measure: oracle request growth, CCIP cross-chain messaging fees, staking supply reduction, and integration momentum across L1/L2s and tokenized real-world assets (RWAs). Our base case lands at $22–$38, our bull case at $48–$85, and our bear case at $10–$16. Each band maps to concrete assumptions you can track month by month.
Why LINK’s 2025 outcome hinges on four fundamentals
- Oracle network demand: Price Feeds, Data Streams, Proof of Reserve (PoR), VRF randomness, and Automation. More requests = more fee flow to node operators and stronger justification for premium valuation multiples.
- CCIP adoption: Chainlink’s Cross-Chain Interoperability Protocol monetizes messages and token transfers between chains and private/permissioned ledgers. If CCIP becomes the default interoperability layer for DeFi + RWAs, the fee TAM expands dramatically.
- Staking & supply sinks (Economics 2.0): Larger staking pools remove circulating supply and align node security/reliability with token incentives. The deeper the stake, the tighter the float in risk-on cycles.
- Enterprise & RWA pipelines: Partnerships, pilots, and production integrations in tokenization (funds, treasuries, commodities) require oracles and messaging with auditability and standards alignment. That creates stickier, multi-year fee streams.
Note: Exact partner counts fluctuate and marketing tallies can lag production usage. For investors, the better north-star is usage telemetry: number of active feeds, feed update frequency, CCIP message counts, VRF requests, Automation upkeeps, staking utilization, and treasury/institutional pilots maturing into paid deployments.
How we translate fundamentals into prices
Rather than hand-waving, we use an intuitive, two-step approach:
- Protocol activity → implied fee run-rate (oracle requests per day × median fee; CCIP messages × message fee; share of PoR/VRF/Automation). This gives a network revenue proxy (most fees accrue to nodes, but the market tends to price LINK as the coordination/secure-work asset that scales with that revenue).
- Revenue proxy → valuation band using a range of EV/Revenue multiples observed in high-growth crypto infra tokens during expansions (often wide: ~8×–25×), then adjust for float reduction from staking and treasury/market structure (CEX balances, on-chain LP depth).
Because LINK does not function like a revenue-sharing equity, we present this as a correlation model rather than a strict DCF. It is still useful: it ties your price view to observable adoption rather than wishes.
2025 Price Targets: Bear, Base, Bull
| Scenario (2025) | Price Band | Oracle/CCIP Assumptions | Supply Dynamics | Macro/Cycle Context |
|---|---|---|---|---|
| Bear | $10 – $16 | Low growth in oracle requests; CCIP remains niche (few DeFi majors, slow enterprise). Fee proxy flat to mildly up. | Staking grows slowly; unlocks/emissions or CEX inflows offset sinks; float remains loose. | Risk-off or choppy crypto; BTC dominance elevated; altcoin rotations brief. |
| Base | $22 – $38 | Steady oracle expansion across L2s; CCIP integrated by several mid/large DeFi apps + select tokenization pilots moving to paid. | Expanded staking pool tightens float; on-chain LP depth improves; exchange balances trend down. | Constructive market with alternating BTC/alt seasons; capital allocates to infra quality. |
| Bull | $48 – $85 | Material CCIP adoption (cross-chain stablecoins/RWA rails); surge in PoR & Data Streams usage; LINK viewed as core infra beta. | High staking utilization + treasury programs reduce liquid float; persistent net outflows from CEXs. | Secular risk-on; DeFi TVL and tokenization volumes accelerate; infra names re-rate to premium multiples. |
We intentionally give bands, not single points. The correct way to use them is to update the inputs monthly. If CCIP messages are doubling quarter-over-quarter and more RWAs plug into Chainlink functions/PoR, you bias toward the upper half of the range. If usage stalls, anchor to base/bear.
What could push LINK into the bull band?
- CCIP as a default: If 3–5 of the largest DeFi protocols route cross-chain liquidity and bridged assets through CCIP, message fee volume compounds. Add 1–2 enterprise/tokenization stacks (funds, treasuries, or payments) and you get non-speculative throughput.
- Proof of Reserve everywhere: Stablecoin and RWA issuers standardize on PoR with high-frequency attestations (minutes, not hours). That’s recurring oracle traffic with defensive moats.
- Staking v2/vX capacity lifts: Bigger staking caps + higher utilization = deeper supply sink, reducing tradable float into strength.
- Data Streams + Automation adoption: Perpetuals, options, and high-frequency DeFi apps pay for low-latency streams + automated upkeeps. Usage is sticky once integrated.
And what drags LINK toward the bear band?
- Competition on low-latency feeds: Alternative oracles capture high-speed perps markets on select L2s; price-sensitive integrators multi-home to cheaper sources.
- Interoperability fragmentation: Protocols build app-specific bridges or use competing messaging layers, capping CCIP volumes.
- Macro volatility: Risk-off regimes reprice long-duration crypto infra. Even with good fundamentals, multiples compress.
- Staking apathy: If yields underwhelm, fewer tokens are staked; supply sinks fail to materialize and rallies meet heavier spot supply.
Historical context (illustrative price path)
Chainlink’s prior cycle showed that infra tokens can massively outperform when usage and narrative align. LINK’s 2021 cycle peak (above $40) was achieved largely on oracle dominance + DeFi summer. Today the product mix is broader (CCIP, PoR, VRF, Automation, Functions, Data Streams), which diversifies demand drivers but also introduces execution complexity. The chart below is a schematic—not a precise price print—meant to visualize how we think about range compression into 2024 and potential range expansion into 2025 under differing adoption curves.
A back-of-the-envelope model you can update monthly
Inputs you track:
- Oracle requests/day across major chains × median per-request fee → Oracle fee proxy.
- CCIP messages/day × message fee + value-based fee (if applicable) → CCIP fee proxy.
- VRF requests/day & Automation upkeeps → Ancillary fee proxy.
- Staked LINK / circulating supply → Float reduction (%).
- Exchange balances trend → Spot supply pressure.
Translate to valuation:
- Sum fee proxies → annualized network activity proxy (NAP).
- Apply multiple range (8×–25×) depending on market regime, competitive moat, and growth acceleration.
- Adjust for float reduction (e.g., if staked share rises 10–20%, nudge per-token value up for the same NAP).
Example (purely illustrative): Suppose by mid-2025 you estimate $120–$180m equivalent NAP, growth 50% YoY, staking utilization rises 10 pts, and market is risk-on. An EV/NAP of 15×–20× would not be unusual for category leaders, mapping to valuations consistent with the upper base to lower bull band in our table. If instead NAP stagnates and competition intensifies, 8×–10× multiples push you toward the bear/base boundary.
Competitive landscape (what to watch)
- Other oracles: Low-latency feeds for perps (e.g., on high-throughput L2s) and first-party data models can undercut fees or reduce switching costs.
- Native protocol oracles: Some DEXs use in-protocol TWAP or bespoke data rails; robust, but not a replacement for cross-ecosystem standards.
- Bridge/messaging rivals: Interoperability is crowded; if CCIP wins enterprise + DeFi mindshare, LINK is re-rated. If fragmentation persists, upside compresses.
Key 2025 catalysts for LINK
- Enterprise tokenization to production: If even a handful of large funds, treasuries, or payments players go live with tokenized products using Chainlink oracles/CCIP, throughput and credibility jump.
- Staking upgrades/capacity expansions: Higher caps and improved reward mechanics deepen the supply sink and security assurances.
- DeFi integrations on L2s: Perps/options protocols standardizing on Data Streams + Automation with CCIP-based cross-chain margining.
- Proof of Reserve ubiquity: Post-stress-event risk culture often mandates on-chain asset attestation; that’s recurring traffic.
Risk checklist
- Adoption execution: Pilots that never convert to paid flows.
- Fee compression: Oracle competitors discount to win logos; multi-homing reduces pricing power.
- Security/regulatory overhang: Messaging layers are high-value targets; any incident or policy headwind can widen valuation discounts.
- Token unlocks/market structure: If staking demand lags unlock schedules or CEX balances rise, rallies fade.
How to use this forecast practically
Treat the bands as living. Each month, score the following on a 0–2 scale and sum:
- CCIP messages/day growth (0 = flat/down, 1 = single-digit %, 2 = double-digit %).
- Oracle request growth across top L2s (0–2).
- Staked/float change (0–2).
- New production enterprise/RWA integrations (0–2).
- Exchange balance trend (0–2, inverted: outflows = 2).
Score ≤3: bias bear/base lower half. Score 4–6: base mid to upper. Score ≥7: start shading toward bull band.
Frequently Asked Questions
Does LINK pay fees/dividends? No. Fees primarily compensate node operators and secure work. Value accrues to LINK via security/staking demand, network effects, and market structure when adoption rises. Some governance proposals may affect economics indirectly, but LINK is not an equity.
Why does staking matter to price? Staking removes liquid supply and signals reliable work guarantees to integrators. In crypto bull phases, the combination of reduced float and rising demand often amplifies upside.
Is CCIP really a big deal? If cross-chain liquidity, payments, and RWA settlement coalesce around a common, audited rail, message volumes compound and the network becomes a default standard. If apps stick to bespoke bridges, upside is more muted.
What time horizon fits LINK? LINK is infrastructure beta. The cleaner thesis pairs a multi-quarter horizon with monthly telemetry checks; it is less suitable for ultra-short-term trades unless you specialize in event-driven governance/tech releases.
Bottom line
LINK’s 2025 outcome should be decided less by memes and more by throughput: how many data updates, attestations, messages, and upkeeps the world actually pays for—and how much LINK gets locked to secure that activity. Watch those needles, and you’ll know which side of our scenario bands is winning long before price headlines catch up.
Disclaimer: This article is for educational purposes only and does not constitute investment advice. Digital assets are volatile and you can lose all capital. Always do your own research.