
Executive summary
This note turns the charts you shared into a concise operational plan. On the H4 time frame BTC is trapped under a clear convergence / resistance band near ~113–115k. If H4 cannot breach that band over the next 48 hours the probability of a sharp short-term reversal increases materially. Conversely, a clean H4 breakout on daily follow-through removes the congestive risk and opens a measured path higher.
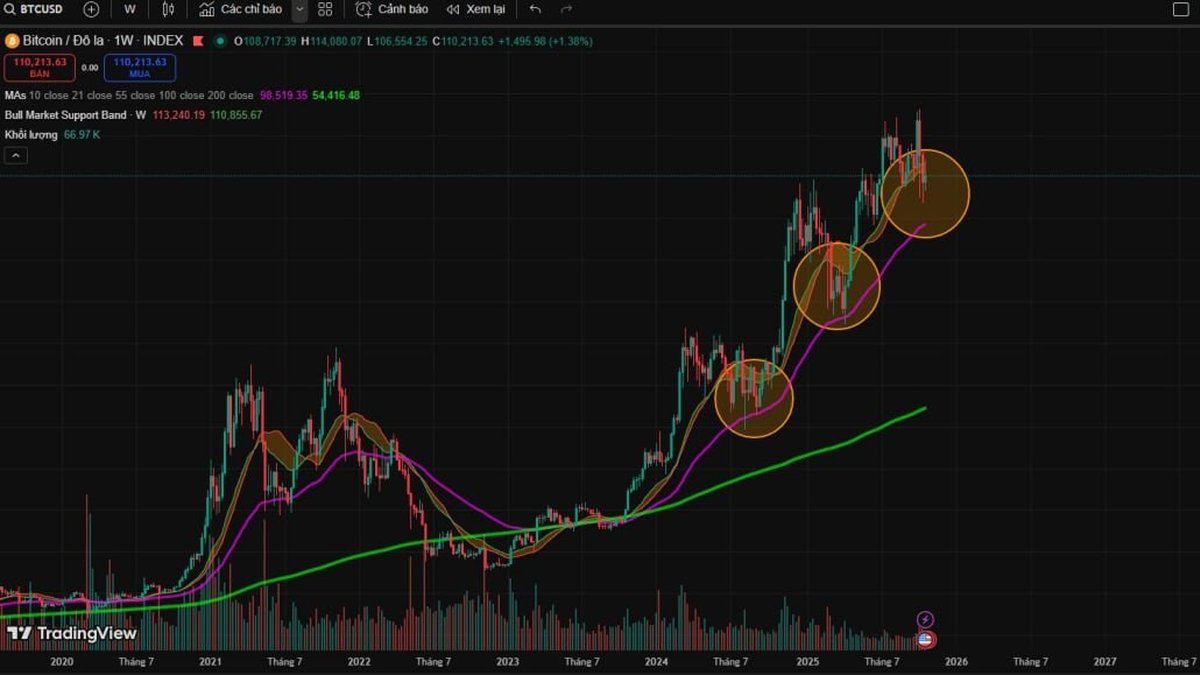
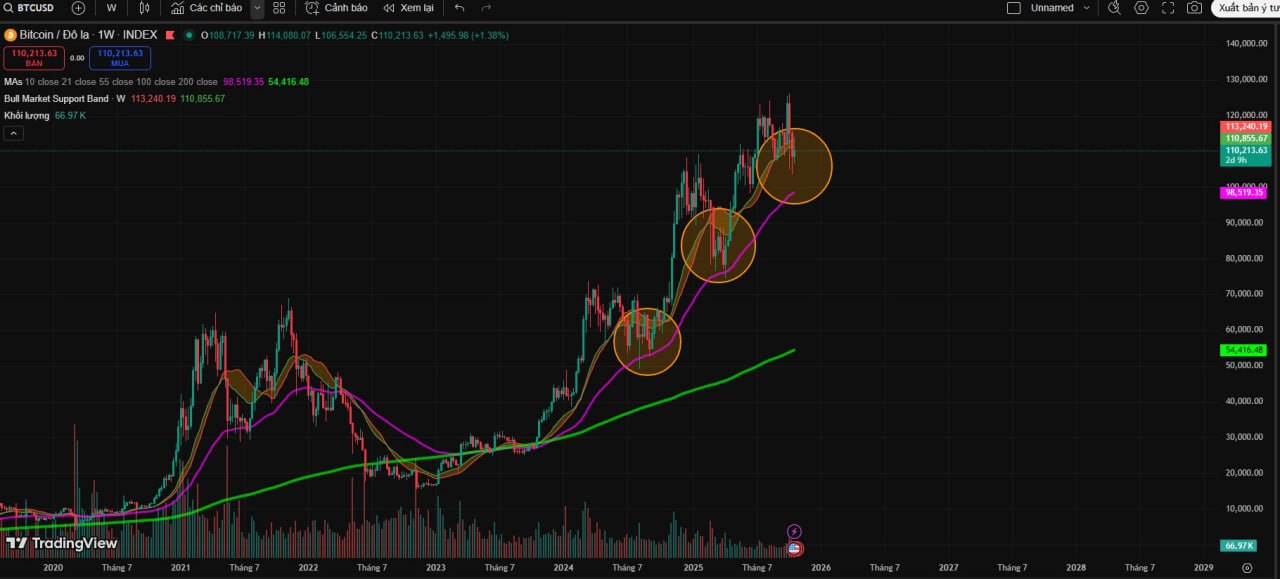
Viewed from the weekly frame, the current drawdown is familiar. Two recent historical episodes (Aug 2024 and Apr 2025) saw BTC break the bull-market band and the weekly 50-EMA, flash a wick back up and then resume the uptrend. The weekly 50-EMA today sits around ~98.5–97.2k and functions as the structural safety net. The worst plausible outcome for traders is a re-test of that zone with a long wick and recovery — the classic ‘shakeout’ that has occurred before. That historical context frames risk management: even a meaningful pullback to ~97–100k should be treated as a regime-typical liquidity sweep rather than a full structural collapse, provided the weekly price behavior is a wick and not a sustained close below the EMA50 with poor on-chain flows.
What the H4 chart is saying (short-term decision map)
Current situation. On H4 the price is meeting a convergence of moving averages and a horizontal resistance band. Price action shows a double-top-ish structure inside that band and a recent failed attempt to hold above the short-term moving average (pink MA on your chart). Volume has not confirmed the breakout attempts and the candles show quicker tails and weaker bodies as we approach the resistance — a classic sign of supply at those levels.

Implication. If H4 cannot close above the convergence band within the next 24–48 hours, sellers will likely take control for a corrective leg that can be fast because H4 traders are typically leveraged or short-term mean-reversion players. The path of least resistance in that scenario is down toward intra-day support clusters, with a larger target being the weekly EMA50 region if the H4 reversal gains momentum.
Alternative (bullish) path. A decisive H4 close above the resistance band followed by a higher H4 low (i.e., breakout → pullback → hold above the breakout level) would be the best short-term confirmation. That opens a path to re-test the 116–118k area first and then a gradual march toward previous structural highs. The difference between a breakout with weak volume and a breakout with rising volume and open-interest expansion is crucial. Trade only on the latter for aggressive positions.
Weekly frame: why the EMA50 band is your structural safety net
The weekly charts in your screenshots highlight a repeating pattern. On both Aug 2024 and Apr 2025 BTC breached the bull-market band and the weekly EMA50, printed a sharp wick back into the band and subsequently resumed the uptrend. Those price events caused fear but ultimately functioned as liquidity sweeps and re-accumulation phases. The EMA50 (currently ~98.5–97.2k) therefore acts as a historical pivot: a sustained close below it would be a genuine warning, while a wick-touch-and-recover fits the historical pattern of short-term panic with long-term continuation.
What to watch on weekly closes:
- If weekly closes remain above EMA50 with bodies that compress and lower volume on the drawdown, the pattern supports eventual mean-reversion higher.
- If weekly closes consecutively print below EMA50 with increasing supply and high distribution volume, the risk has shifted from a shakeout to a regime change.
Concrete scenarios and probabilities (operational)
Below are three actionable scenarios. We include subjective probabilities to help sizing decisions. These are not forecasts but operating priors for trade decisions.
1. H4 failure → short-term reversal to intra-day supports (~30–40% probability).
Signal: H4 prints failure-to-break pattern with increasing bearish H4 volume and an H4 close back under the short-term MA band. Outcome: a 3–7% impulse down within 24–72 hours, potentially extending to 7–12% if funding events or liquidation cascades occur. Tactical plan: trim re-scaled longs, prepare short-range short or put hedge, and mark support zones for re-accumulation.
2. H4 breakout + daily confirmation → bullish continuation (~40–45% probability).
Signal: H4 clean breakout with volume >1.5× average, followed by daily follow-through and higher H4 lows. Outcome: push to 116–118k then to the previous structural highs. Tactical plan: add to breakout with staggered scale-ins, keep a portion for a run to higher structural levels, trail stops with H4 higher-lows.
3. Large retrace to weekly EMA50 — structural shakeout (~25–30% probability).
Signal: strong H4 reversal that accelerates and turns momentum on multi-day basis, leading to a test of ~97–100k. Outcome: high panic, but likely wick-and-recover as per historical patterns. Tactical plan: reduce levered exposure, accumulate with smaller sizes into the weekly EMA50 only if price shows a voluminous wick and on-chain flows (inflows to exchanges vs outflows) show accumulation.
Execution rules — how to act in each scenario
- If H4 stays under resistance (probable short-term reversal):
- Do not chase longs at current highs. Tighten stops for active long positions to preserve capital (example: move stop to breakeven or just under recent H4 swing low).
- If you trade intraday, consider short entries after a confirmed H4 breakdown with a cap at the previous breakout band. Use a small size and target the first intra-day support at 106–108k (adjust to real-time price), then trail or scale out.
- Watch funding rates and liquidation levels. Rapid funding spikes with falling price often precede violent moves.
- If H4 breaks out (bullish execution):
- Confirm breakout with increased volume and a higher H4 low before adding materially.
- Place initial target 1 at 116–118k for partial profits; target 2 at 122–130k (structural extension zones). Trail stops using 4H higher-lows.
- Avoid full-size entries on the first breakout candle. Use staged entries to avoid false-breakout risk.
- If weekly EMA50 test arrives (buy-the-test plan):
- Do not leg in large positions beforehand. Instead, prepare an accumulation ladder stretched across ~100–97k with very small entries and a plan to scale larger only after a voluminous wick and a weekly close showing a recovery wick.
- Use buy limit orders with strict risk per entry (e.g., 0.5–1% portfolio per ladder rung) and allocate the majority of the long allocation only after the market proves sellers are exhausted.
Risk management: size, stops and hedges
Key rules to protect equity:
• Keep position sizing conservative around structural levels. For swing traders risk 1–2% of equity on any single position; for aggressive traders 2–3% but reduce if correlation across positions rises.
• Use time-based stops for leveraged trades: if your thesis does not resolve within X H4 bars (e.g., 12–18 H4 bars ~ 2–3 days), re-evaluate and reduce size.
• Consider small options hedges (puts) if expecting a violent shakeout to the weekly EMA50 but want exposure. Hedges should be sized to protect the portfolio rather than to be speculative.
• Never abandon a written risk plan. Predefine stop levels and slippage tolerance.
Indicators and on-chain signals to validate the plan
Watch these data points every session:
• H4/1H volume on breakout attempts. Breakouts need higher-than-average volume for credibility.
• Perps funding and OI. Rising OI with positive funding and bullish price is healthy; rising OI on a price rejection warns of liquidation risk.
• Exchange inflows/outflows. Net inflows to exchanges when price rejects a resistance band is a red flag. Net outflows on constructive candles is positive context.
• Weekly close behavior around EMA50. A wick with heavy buy volume supports the shakeout-as-opportunity thesis.
• RSI / MACD divergences on 4H and weekly. Bearish divergence on H4 + rejection at resistance increases the short-term reversal odds.
Practical checklist for the next 72 hours
- Set an alert for a clean H4 close above the resistance band and a follow-up alert for a higher H4 low.
- Set a separate alert for H4 close below recent swing low that signals the start of the short-term reversal.
- Monitor funding and OI across major venues; note divergence between CEX and DEX flows.
- If price approaches weekly EMA50, reduce leverage and prepare the buy-the-test ladder as described above.
- Keep a 24-hour watch for major macro headlines (inflation data, Fed commentary, geopolitical events) which can flip short-term structure quickly.
Final thoughts — temperament and the bigger picture
The charts present a clear, disciplined approach: treat the current H4 congestion as a short-term decision node and the weekly EMA50 as the structural safety net. The market has historically used similar drawdowns to sweep liquidity and then continue higher; that history gives us both courage to buy into weakness and discipline to respect structure. The key to surviving and prospering in this environment is to (1) size conservatively, (2) trade confirmations rather than emotions, and (3) maintain a checklist-driven process.
In plain language: if BTC breaks the H4 convergence with credible volume, participate. If it fails, respect the reversal, protect capital, and either hedge or plan to accumulate at the weekly EMA50 when the market proves sellers are exhausted. Do not be surprised. Have orders pre-placed where you want to buy, but accept that liquidity and slippage will change; trade the market you have, not the market you want.
This plan is operational, not prescriptive advice. It synthesizes price structure, historical weekly patterns and prudent risk mechanics into a repeatable playbook for the next 7–21 days.


