Executive Summary: The Signal Inside the Noise
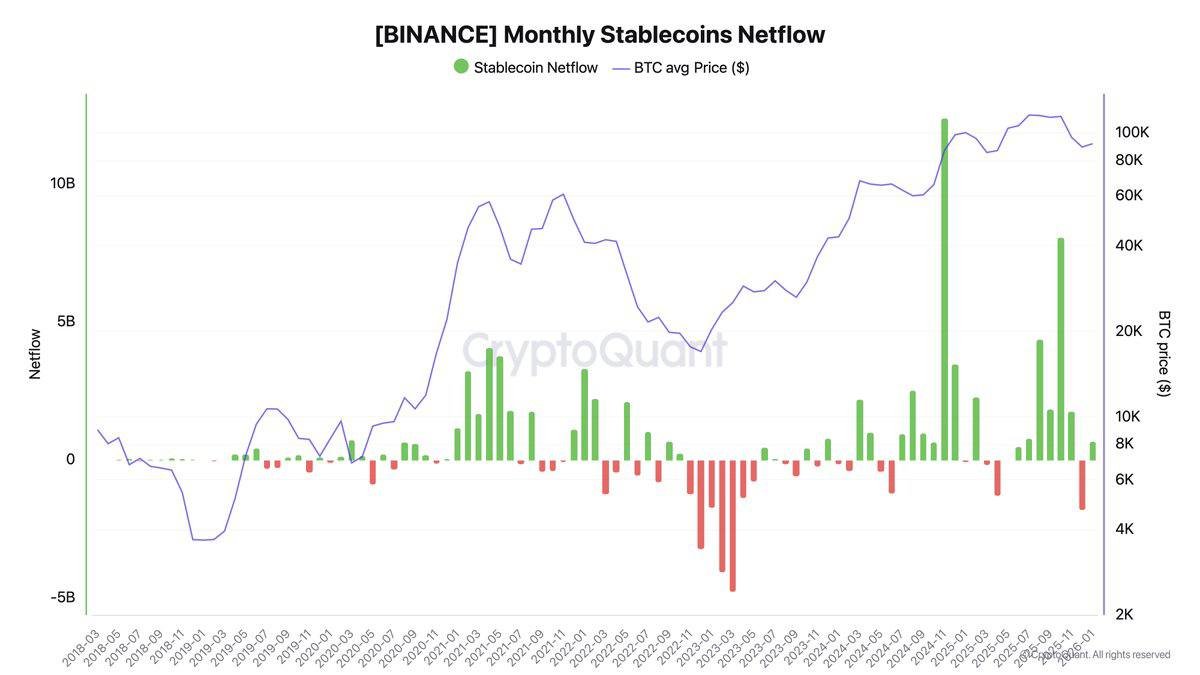
Bitcoin has whipsawed below and above the six-figure line several times in early November, with the most recent slip under $100,000 accompanied by headlines of whales 'cashing out billions' since the $100K tag. CryptoQuant’s CEO Ki Young Ju publicly noted large-holder profit-taking as price reclaimed and hovered near six figures, reinforcing the impression of distribution into strength. ([Bitbo][1])
The behavior isn’t happening in a vacuum. U.S. spot Bitcoin ETFs just logged a rough patch—multiple consecutive outflow days totaling around ~$2 billion across a recent week—second only to the heavy red tape in February 2025, a meaningful datapoint given how central ETF flows are to post-approval price discovery. ([Yahoo Tài Chính][2])
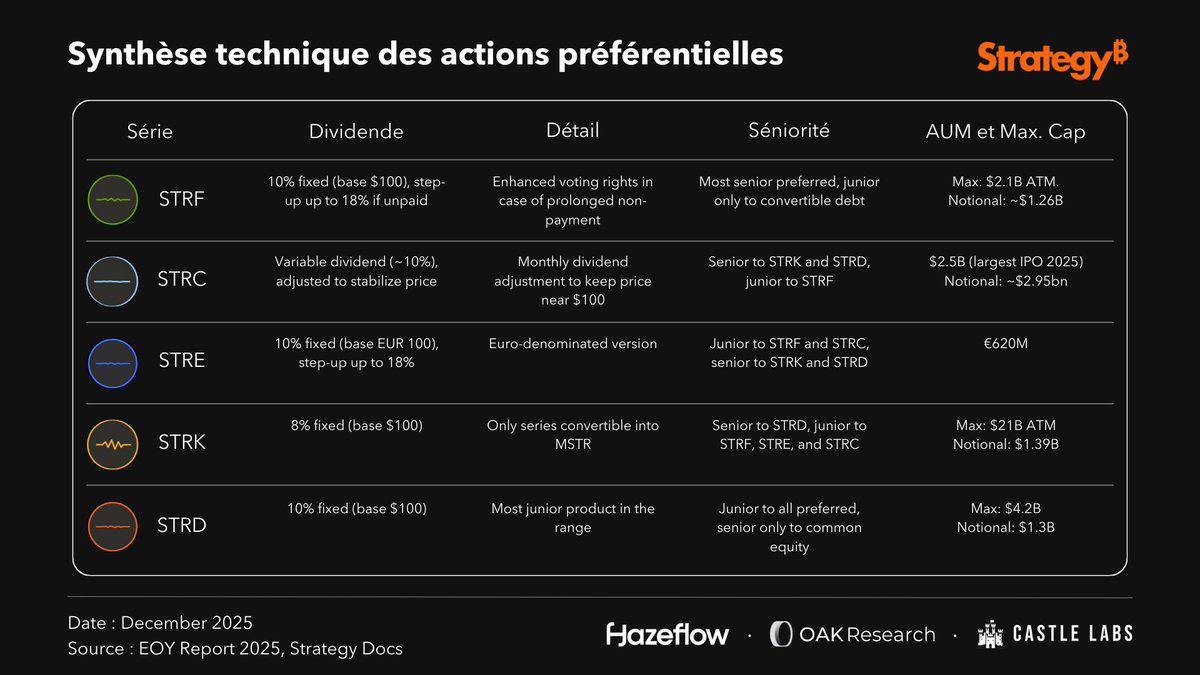
At the same time, programmatic and corporate demand hasn’t disappeared. MicroStrategy, the most visible corporate buyer, disclosed another purchase—487 BTC for roughly $49.9 million—underscoring that not every large wallet is a net seller at these levels, even as the company refines its financing mix. ([Bitget][3])
So where are we in the cycle? Classic market-structure doctrine (think Wyckoff) says distribution can precede deeper drawdowns—but it can also morph into re-accumulation if new demand steps in and sellers tire. The difference is plumbing: flow, depth, and positioning. ([Glassnode][4])
What the On-Chain and Flow Tape Actually Say
1) Whale Distribution Is Real—but Not Absolute
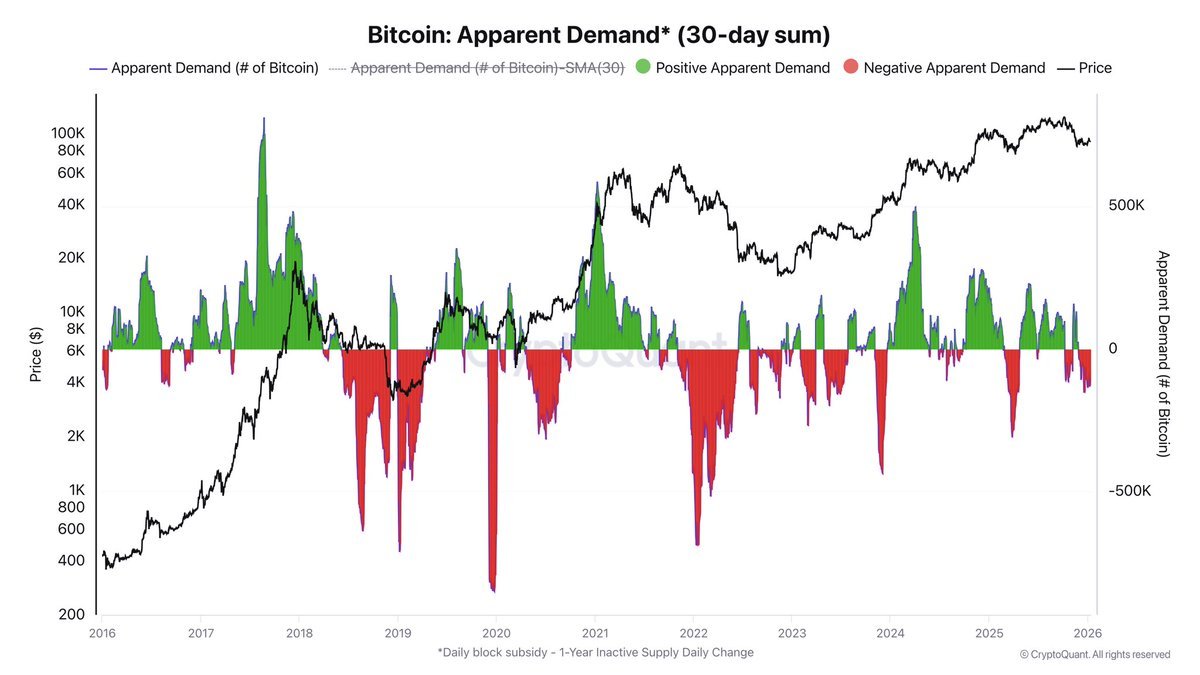
Multiple trade press recaps, referencing CryptoQuant readouts and CEO commentary, flag that large holders have been distributing since the first tags of $100K. The language varies—“cashing out billions,” “taking profits”—but the through-line is clear: some long-tenured capital sold into strength as the market revisited marquee levels. ([Bitbo][1])
Complementing that, broader coverage this month emphasized the unusual role of long-term holders in the latest downdrafts, with one mainstream summary tying a sub-$100K break to an estimated ~$45B of BTC sold by older cohorts. While press tallies can be imprecise, the directional message aligns with on-chain dashboards showing higher LTH spending than in mid-year. ([The Times of India][5])
2) ETF Flows: The Marginal Bid Blinked
The second layer is ETF demand. In early November, U.S. spot ETFs posted a rare, multi-session outflow streak with notional redemptions around $2B. For a market that adapted to steady passive inflows for months, this reversal tightened the near-term demand-supply balance and removed a source of reflexive dip-buying. Historically, short clusters and weak depth make such episodes look worse than they are—but persistence matters. ([Yahoo Tài Chính][2])
3) Corporate Buyers Still Buying (Selectively)
MicroStrategy’s disclosed top-ups—487 BTC (~$49.9M)—signal that some balance-sheet allocators continue to add on weakness/flat tapes. This doesn’t negate whale distribution; it shows the market is two-sided and that treasury-style demand remains an important offset to selling, especially if financing channels stay open. ([Bitget][3])
4) Liquidity and Microstructure: Depth Is the Decider
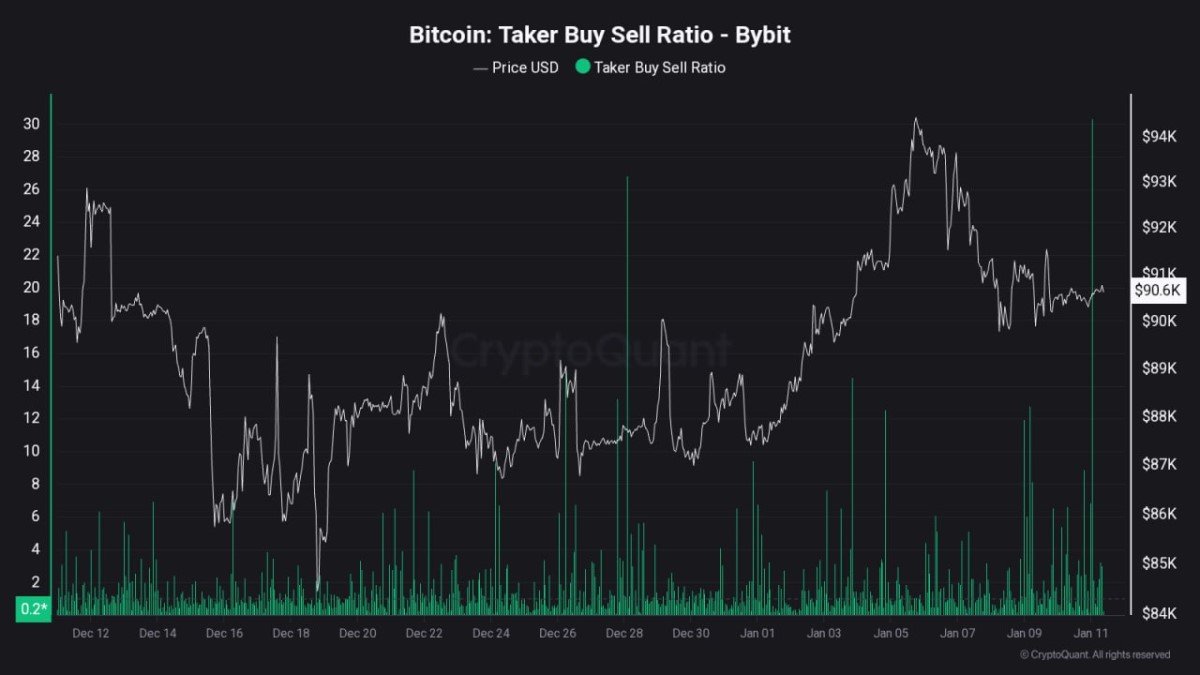
When whales sell into a market with thin resting bids and poor top-of-book replenishment, small notional orders create outsized impact. This cycle’s microstructure is unique: a larger share of flows route through ETFs (with T+ settlement and AP arbitrage loops), RFQ/OTC desks, and fewer “always-on” crypto-native prop books than in 2021–22. As a result, the tape occasionally “gaps” around big news, and stop cascades become visually dramatic. (This is consistent with how depth shocks amplify drawdowns in other risk assets.)
Is This Wyckoff Distribution or a High-Level Range?
Wyckoff’s framework describes topping phases as a dance between supply and demand in a trading range: upthrusts, tests, lower highs, and eventual markdowns. Skeptics point to repeated failures above ~$110K and the presence of heavy supply from older coins. But Wyckoff also allows for the opposite outcome: if demand reasserts and sellers fail to push price to new lows, the same range resolves upward. The schematic is a guide, not a verdict. ([Glassnode][4])
Six Questions That Will Decide the Path from Here
1. Do ETF flows turn back to net positive? Even modest daily net creations historically stabilize intraday liquidity and crowd in systematic dip-buyers. Another week of aggregate redemptions would keep pressure on price discovery. ([Yahoo Tài Chính][2])
2. Do long-term cohorts slow their spending? Coin-days destroyed and dormancy metrics can reveal fatigue in older supply. A visible deceleration would reduce the MOC (market-on-close) supply overhang implied by recent profit-taking. ([The Times of India][5])
3. Does top-of-book depth recover? Depth at 1–2% bands on major BTC-USD venues is a leading indicator of slippage risk. If it rebuilds while flows stabilize, ranges tend to hold.
4. Are corporate/treasury buyers stepping in? Fresh disclosures (10-Q/K, press notes, or executive posts) from balance-sheet accumulators like MicroStrategy help replace passive ETF demand during flow slumps. ([Bitget][3])
5. Is basis orderly? Healthy futures basis (non-spiky, positive but not euphoric) suggests leveraged positioning isn’t forcing liquidations at every downtick.
6. Does macro stay “quiet”? High-beta assets hate regime shifts. If rates volatility and dollar shocks remain muted into year-end, crypto has a better chance to consolidate rather than trend break.
Reconciling Conflicting Signals
Bears see (a) whales distributing near psychological round numbers, (b) ETF investors voting with their feet, and (c) repeated failures to stick above prior resistance. Their conclusion: a medium-term top is forming, with rallies sold and lower highs ahead. ([Bitbo][1])
Bulls point out (a) whale selling occurs in every cycle but often peaks before the final leg, (b) distribution can be absorbed if new demand shows up (corporates, sovereign wealth, ETFs flipping back to creations), and (c) structural adoption—developer growth, payment rails, tokenization pilots—keeps improving reflexively even during price stalls. In that vein, recent corporate purchases illustrate a subset of buyers that add into weakness. ([Bitget][3])
Price Levels and the Myth of a Single 'Line in the Sand'
Many social posts fixate on granular levels (e.g., $111,700). Technical levels matter for liquidity clustering, but a market this large respects zones more than precise ticks. The tape has repeatedly shown supply above $100K–$110K and dip demand below $95K–$98K during fast moves, but the critical variable is time spent at each zone—and whether the next test comes with more or less participation than the last. Put differently: participation > precision.
What History Implies (Without Cherry-Picking)
In prior cycles, whale distribution often started well before macro tops and continued through long consolidations—sometimes pausing abruptly when ETFs/pension allocations or macro catalysts re-introduced one-way demand. This cycle’s novelty is the ETF wrapper itself: it concentrates a meaningful portion of marginal demand into a daily creations/redemptions pipe. When that pipe runs in reverse for days, even resilient spot orderbooks feel much heavier than they are. ([Yahoo Tài Chính][2])
Why This Might Be a Top
- Persistent ETF outflows keep passive demand negative and embolden covered-call and short gamma overlays.
- Long-term holders are finally distributing in size, which historically accompanies late-cycle transitions rather than fresh expansions. ([The Times of India][5])
- Liquidity is thinner than headline market cap implies, so each “sell wave” prints exaggerated candles.
Why It Might Not Be
- Corporate balance sheets are still net accumulators. Disclosures of incremental buys (e.g., MicroStrategy) show two-sided flow. ([Bitget][3])
- Distribution is path-dependent. If sellers fail to push new lows and ETF flows flip green, the same supply becomes the seed for a squeeze higher.
- Wyckoff is descriptive, not deterministic. Ranges break both ways; demand catalysts decide. ([Glassnode][4])
Scenario Analysis: Framing the Next 4–12 Weeks
1) 'Distribution to Markdown' (Probability ~35%)
ETFs remain net negative week-over-week; whales keep selling rallies; depth stays thin. We print a sequence of lower highs (e.g., fails in the $104K–$108K area), with spikes that fail at supply. Realized vol creeps higher; alts underperform beta. This path risks a more durable down-channel until the flow picture resets. ([Yahoo Tài Chính][2])
2) 'Range and Re-Accumulation' (Probability ~45%)
Outflows moderate; the worst whale spending abates; corporate/RFQ desks quietly absorb. Price builds acceptance between mid-$90Ks and low-$100Ks. Breadth improves gradually; perp basis stabilizes; funding normalizes. This is the most common outcome after first wave distribution in prior cycles.
3) 'Coiled Spring' Breakout (Probability ~20%)
Surprise catalyst flips ETF pipe to creations and re-risking (policy clarity, new institutional mandates). Supply proves one-time; $110K+ holds on retests; the tape melts up as shorts cover. Momentum strategies re-engage; alts see staggered catch-up over weeks, not days.
How to Read the Tape Day to Day
• ETF flow prints: Creations/redemptions (by fund) and the aggregate net are the cleanest daily demand proxy. Two to three consecutive green sessions after a red streak historically mark local stabilization. ([Yahoo Tài Chính][2])
• Orderbook depth at 1–2%: Watch the rebuild. If depth recovers ahead of a macro data point, downside tails shorten.
• LTH spending/dormancy: A visible slowdown in old-coin spending often precedes range formation after sell waves. ([The Times of India][5])
• Corporate disclosures and treasury chatter: Even small prints (hundreds of BTC) matter at the margin when ETFs are flat. ([Bitget][3])
Altcoins: Don’t Front-Run Beta
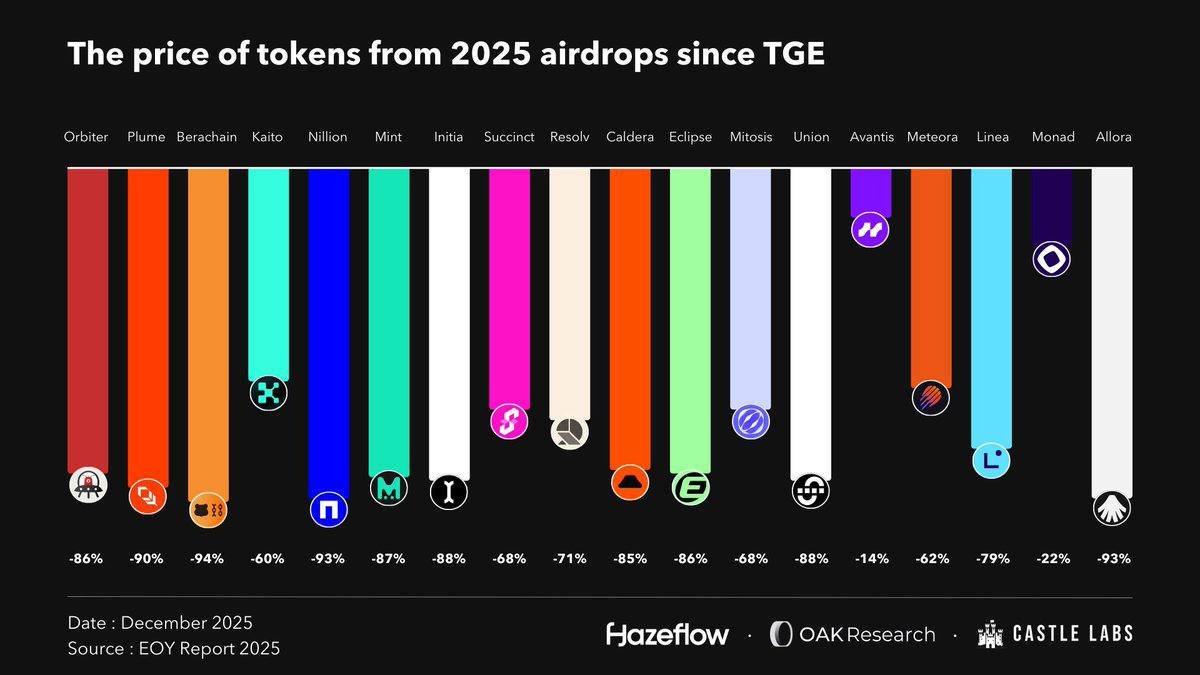
Alts absorb the brunt of liquidity shocks when BTC volatility rises and ETFs are net negative. The “alt season” that many expect tends not to anchor until BTC either (a) breaks to new highs and holds, pulling in trend followers; or (b) compresses in a stable range with declining vol, attracting rotation. In a distribution-leaning regime, beta drawdowns in alts typically exceed BTC on the way down and lag on the way up.
Risk Management: Practical Guardrails
- Avoid binary speculative positions on single levels. Trade zones with clear invalidation: e.g., a plan that survives both a $95K sweep and a $108K rejection.
- Size for thinner depth. Slippage rises during flow slumps; reduce size or widen bands for stops.
- Consider staggered entries. Scale rather than pick single “perfect” prints; respect that ETF tapes and whale wallets can surprise on timing.
- Monitor basis and funding. If perp funding grinds positive while ETFs still redeem, be wary of rally quality.
Bottom Line
Yes, whales have been distributing around $100K–$110K, and yes, the ETF pipe blinked with multi-day outflows. Those pieces tilt the near-term balance of risks to the downside. But a topping pattern is not ordained. The same market has shown that modest, consistent ETF creations, plus sporadic corporate buys, can absorb distribution quickly. The next 2–6 weeks come down to flows and depth: if demand reappears and older supply cools, we range and coil. If not, distribution likely converts to markdown before the next impulse leg. ([Bitbo][1])


