What the posted weekly chart is saying
Your weekly chart frames a rising price channel with three prior tests of the lower rail highlighted by circles, and blue vertical markers that align with those tests. Below, weekly RSI is in a clear falling wedge of lower highs, but every time price tagged the channel support, RSI also tagged the 44–45 zone and reversed. That combination — price into structural support while momentum kisses regime floor — has delivered the same microstructure each time: two heavy red weeks, then a third week that flushes below the line, harvests stops, and springs higher. In two of the earlier occurrences, the third candle finished green or with an aggressive lower wick. The question now is whether we are watching the same film again, only fast-forwarded by late-cycle compression.
Why the two-red-then-flush pattern exists
Markets travel through liquidity. A weekly trendline that is widely watched accumulates stops just beneath it (leveraged longs, trailing discretionary risk, and quant models using the line as a regime switch). During stress, the first down week pulls price to the line; the second week bleeds through intraday as systematic supply accelerates. By week three, liquidity pools have thickened under the line. A further push lower trips those clustered stops, fills patient bids, and, if demand is real, prints a reversal wick. In a late-cycle bull, that wick often carries into several weeks of follow-through.
It is crucial to remember that the channel line is not magic; it is a proxy for average positioning. The third-week undercut is a behavioral pattern, not a law. Your edge is knowing where others will be forced to act, then requiring confirmation (close, not just wick) before committing size.
The RSI regime: 44–45 as the floor for this cycle
Momentum regimes matter as much as raw price levels. In persistent uptrends, weekly RSI often oscillates between a floor in the mid-40s and a ceiling in the 70s. The floor signals that pullbacks expend momentum without breaking trend; the ceiling tells you when rallies are mature. On your chart, every trip to 44–45 has coincided with the price tests of the lower rail. The important nuance: the signal is the close , not the intrawork. RSI can stab under the band intrawork and still close above it at the week’s end — that has been enough to preserve the bull regime. A weekly close
beneath 44, however, has not occurred in this cycle while price stayed in the upper half of the channel. If it does so now, the burden of proof swings to the bulls.
Late-cycle mechanics: faster and more violent
Early in a cycle, oscillations around a channel line can take months to resolve; emotions are milder, leverage is modest, and passive inflows absorb shocks. Late in a cycle, positioning is heavier, narrative transmission is instant, and option books are thicker. That compresses time. The two-red-then-flush pattern can complete in as little as 2–3 weeks end-to-end, and the rebound to resistance can happen within a handful more. The read-through for risk management is straightforward: define invalidations now; waiting for perfect clarity often means paying 10–12% more.
The decision tree for the current test
We translate the chart into an if-then map that a desk can execute:
• Bullish resolution (shakeout): The current weekly candle undercuts the lower rail, but closes back above it and, critically, above the psychological 100k handle. Weekly RSI finishes in or above 44–45. The following week opens with follow-through that reclaims the broken mid-channel region and attacks the 109–110k shelf. From there, an impulsive leg to 112–116k is plausible, with a later retest of 109k as the classic check-back.
• Neutral churn (range repair): Price closes near 100k, RSI near 44–45, and subsequent weeks chop between 97k and 110k while the market rebuilds acceptance. Expect intrawork sweeps in both directions. In these ranges, higher-timeframe confirmation (weekly closes) should dominate decision making; intraweek moves are mostly liquidity hunts.
• Bearish resolution (trend break): Weekly close below 100k and weekly RSI close under 44 — preferably in concert — would be our unambiguous regime shift. In that case, the next demand shelves sit near 92–95k and 86–88k, with the lower bound aligning to prior consolidation and volume nodes. Alts would likely underperform dramatically if this path emerges.
Levels that matter right now
• 100k round number: A weekly close back above keeps the script of a wick save intact and avoids a psychological de-anchor.
• 97–96k: The immediate battleground shown on your chart; closing below turns the lower rail from support into resistance until proven otherwise.
• 92–95k: The first fat demand shelf if the wick save fails — a high-volume area from earlier base formation and the site of prior weekly closes.
• 109–110k: Retake and hold here to exit the penalty box; in the shakeout-then-spring script, this zone is where momentum proves itself.
• 112–116k: Upper-range target for the first impulsive relief leg; previous supply and the underside of recent distribution.
• 120–123k: Upper rail tests and prior weekly resistance. Clearing with acceptance would argue for a late-cycle final drive.
The market-microstructure tells to confirm or fade the wick
Weekly candles summarize an entire week of orderflow; to avoid optical traps, pair the candle with underlying plumbing:
1. Perpetuals funding and basis: In genuine shakeouts, funding stays negative into the save, then trends toward neutral as spot drives. A flip to positive funding before price retakes 100k usually signals a dealer-led bounce lacking real demand.
2. ETF and wrapped-vehicle flows: Counter-cyclical net creations on red weeks have been a hallmark of healthy demand through this cycle. If those flows go red alongside a sub-100k close, fade bounce attempts.
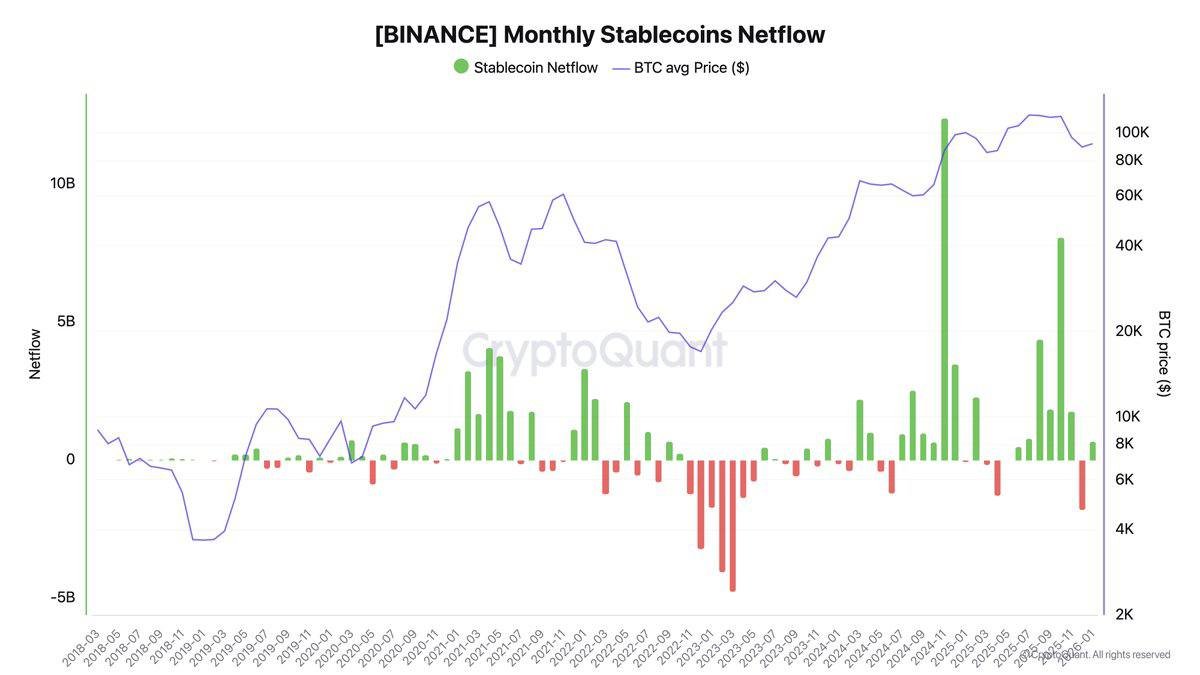
3. Stablecoin exchange balances: Rising balances as price stabilizes equals dry powder. Falling balances during a bounce equals redistribution risk.
4. BTC dominance and ETH/BTC: In wick-save rallies that endure, dominance stabilizes or falls and ETH/BTC stops bleeding. If dominance spikes and ETH/BTC makes new relative lows, the market is defensive; do not extrapolate strength from BTC alone.
How to operationalize the pattern
Because this is a weekly setup, execution should respect weekly closes. That said, tactical entries on lower timeframes are allowed if they are in service of the weekly thesis.
• Entry logic for the shakeout path: Scale a first tranche if the current weekly candle reclaims the lower rail intrawork and daily closes begin stacking above 100k while funding is still negative or at worst flat. Add on the weekly confirmation close above 100k with RSI defending 44–45. Finalize position on the first weekly close back inside the mid-channel or above 109–110k.
• Risk anchoring: The invalidation for the shakeout path is a weekly close below the wick low that defined the flush and, secondarily, a weekly RSI close below 44. Give the trade room to breathe intrawork; late-cycle volatility is episodic and punishes tight stops placed on obvious levels.
• Profit taking and rotations: Trim into 112–116k; if price then back-tests 109k and holds with breadth improvement, rotate some beta toward high-quality large-cap alts. If breadth fails, keep the focus on BTC.
What would confirm a true downtrend
Professional language for a trend break requires more than a headline. We would need at least two of the following in the same week: 1) weekly close sub-100k, 2) weekly RSI close below 44, 3) follow-through selling into the next week that prevents a quick reclaim of the lower rail, 4) deterioration in flows (ETF net outflows, falling stablecoin balances, positive funding into weakness). Should those conditions appear, treat rallies into the underside of the broken rail (now resistance) as opportunities to reduce risk or hedge, not as dip-buys.
Why this specific RSI band matters
Some readers will ask why 44–45 and not 40, 50, or another round number. Two reasons. First, empirical: on your chart and throughout the cycle, the bull phases printed higher highs while finding swing lows around the mid-40s RSI. Second, structure: that band coincides with prior weekly inflection points where selling pressure exhausted without collapsing breadth. Once RSI loses that band and fails to reclaim it quickly, subsequent rallies typically end in lower highs. The RSI band thus functions as a momentum stop for swing traders even if price temporarily spikes above broken trendlines.
Scenario analysis with path probabilities
1) Wick-save and acceleration (40%)
The third weekly candle undercuts the rail, but finishes green or with a long lower shadow above 100k; RSI closes 44–45. The following 1–3 weeks advance to 112–116k, then check back to 109k and continue. Breadth improves; ETH/BTC stabilizes. This is the classic late-cycle spring that steals coins from the impatient.
2) Range repair (35%)
The week closes roughly at the rail and 100k; RSI hugs 44–45. The next month carves a rectangle between 97k and 110k. Volatility compresses, positioning resets, and the next decisive move emerges out of that base. In this path, patience and option-selling strategies tend to outperform aggressive directional speculative positions.
3) Break and trend change (25%)
Weekly close below 100k and RSI closes under 44; follow-through selling in the next week keeps price pinned below the former rail. Demand shelves at 92–95k and 86–88k come into play. BTC dominance rises, and alts suffer amplified drawdowns. In this regime, rallies into 100k–103k are for risk reduction until the first weekly higher low is in hand.
What this means for altcoins
Alt seasons do not begin from fear; they begin when BTC stabilizes, liquidity expands, and ETH/BTC bottoms. If the wick-save path wins, expect a staged rotation: BTC first, then ETH, then high-quality large caps, and only later the long tail. If we print the trend-break path, altcoins will remain a source of funds. In either case, the weekly timing is compressed — the market may move from BTC rescue to early rotation within a month, not a quarter.
How to avoid the three classic mistakes here
- Chasing the intrawork spike. The wick-save script often includes +7–10% daily surges that reverse intraday. Demand the weekly close for confirmation.
- Ignoring flows. A beautiful candle without supportive ETF/stablecoin data is cosmetic. Price can levitate for days on short covering; it cannot trend for weeks without fresh capital.
- Over-rotating to alts too early. Until ETH/BTC flattens and BTC dominance stops rising, alt exposure is a tax on returns.
Putting numbers on the plan
- Upside magnets after a save: 109–110k, then 112–116k, later 120–123k if breadth broadens.
- Downside shelves if the save fails: 95k (first response), then 92k and 88k (deeper test). A weekly close below 88k would mark an unambiguous regime change with multi-month implications.
- Momentum tells: Weekly RSI reclaims 50 on any advance to 112–116k — that would validate continuation; failure to do so raises odds that the move is merely a bounce within distribution.
Bottom line
The setup is clean, the stakes are high, and the timing is compressed. The weekly channel lower rail and the RSI 44–45 band have defined the bull regime. Respect them. If this week ends with a long lower shadow and a close back above 100k while RSI defends the band, the historical three-candle flush pattern remains intact and the path opens toward 112–116k and potentially 123k after a check-back. If instead the week closes below 100k with RSI closing beneath 44, call the bounce a bounce and prepare for a trend transition. In late cycles, the right response is not prediction — it is a prepared decision tree and the discipline to execute it.


