Fresh data shows Bitcoin net outflows from Binance turning deeply negative on a 30-day basis—an impulse many read as accumulation. Historically, shrinking exchange balances can front-run lower sell pressure and a coiled spring for the next leg up. Yet not all outflows are equal: custodial reshuffles, hedged positions, and short-term volatility can muddy the message. This long-form unpacks what the flow really measures, how to separate signal from noise, and a practical checklist for confirming a real trend shift
When Bitcoin leaves exchanges, crypto Twitter gets loud. The narrative is simple and intuitive: fewer coins sitting on order books, less sell pressure, better odds of an upside break. This week, the Binance Bitcoin Netflow metric—net deposits minus withdrawals—sank deeply into negative territory and stayed there on a 30-day moving average. In plain English, more BTC has been leaving Binance than entering it for weeks. The directional takeaway is tempting: investors prefer to hold rather than trade, a classic hallmark of accumulation phases. But is that really what’s happening, and if so, what tends to come next?
What Netflow Measures (and Why the 30-Day Average Matters)
Netflow equals coin inflows minus coin outflows over a given window, usually expressed in BTC or USD terms. Negative netflow means coins are exiting; positive means they’re coming in. The 30-day moving average is a simple but powerful filter. Day-to-day flows are noisy—arbitrage rotations, market maker inventory changes, internal wallet reshuffles—while a monthly glide slope removes a lot of that static. If the 30-day line drifts lower for multiple weeks, it suggests the typical day is one where BTC leaves the venue, not the other way around.
Why should that matter? Exchanges are the most direct path to immediate selling. Coins sitting in private custody are not automatically bullish, but they are less immediately available to hit the bid. Sustained outflows, especially after a volatile patch, often map to investors moving toward longer-horizon storage or simply stepping off the treadmill of intraday churn.
Three Common Interpretations of Sustained Outflows
- Classic Accumulation: Long-only cohorts—treasuries, high-conviction funds, HODLers—buy coins and withdraw to custody. Exchange balances shrink, realized distribution slows, and downside elasticity improves because fewer impatient coins sit above the bid.
- Risk Management After Shock: After liquidations or a scary drawdown, active traders reduce venue exposure to limit counterparty risk. They might be neutral on price but move coins to cold storage until the dust settles. Outflows, in this case, reflect caution, not necessarily bullishness.
- Structural Migration: Coins leave a CEX (e.g., Binance) for a prime broker, institutional custodian, or L2/DeFi venue where they are rehypothecated, pledged, or otherwise used. This looks like outflow from the exchange but might not reduce market-ready supply if those coins remain one step away from being redeposited quickly.
The truth on any given week can be a mix of all three. That’s why pairing netflow with corroborating evidence is essential.
What Shrinking Exchange Balances Have Meant in Past Cycles
Across cycles, there’s a recurring pattern: after a period of fear or forced selling, exchange coin balances trend down for weeks or months. Price may chop or even drift lower, but realized losses moderate, long-term holder (LTH) buckets grow, and the market transitions from weak hands price discovery to time-based consolidation. Later, when volatility compresses and macro headwinds ease, that leaner on-exchange inventory can exacerbate the upside: fewer resting asks, thinner reloads, faster slippage for late buyers. In short, outflows don’t guarantee higher prices, but they raise the ceiling for how far an upside impulse can reach if and when demand returns.
Why “Outflow = Bullish” Can Still Be a Trap
It’s easy to romanticize outflows. A few caveats keep you honest:
- Internal Wallet Movements: Large exchanges regularly consolidate, fragment, and rotate coins between hot and cold storage. If your data provider misclassifies a cluster, you might read a housekeeping event as a mass exodus.
- Derivatives Overlay: A fund can withdraw spot BTC while simultaneously adding short exposure in perps or futures. Netflow looks bullish, but net delta can be flat or even short.
- Custody Isn’t Stasis: Custodied coins can come back to the exchange within minutes if the thesis changes. The lower the friction between custody and venue, the less predictive value raw outflow has.
Hence the need for confluence: combine netflow with funding, basis, realized profit/loss, and breadth to build a stronger inference.
The 30-Day Signal Right Now: What It Probably Says
With Binance’s 30-day BTC netflow deeply negative, the highest-probability read is that a meaningful share of market participants prefer to hold off-exchange rather than keep inventory in the order book. That preference tends to surface during accumulation or pre-breakout regimes: patience rises, traders scale back compulsive rotation, and the market waits for a catalyst. In that waiting room, price action often changes character—lower realized volatility, more respectful retests of support, smaller wicks through obvious levels, and a drift toward time-based consolidation (sideways ranges with higher lows).
How to Separate Signal from Noise: A Five-Lens Checklist
- Netflow Quality: Is the outflow persistent on a 14–30 day basis, or did a single batch transfer skew the chart? Look for clusters of outflow days rather than one-off spikes.
- Spot vs. Derivatives: Are spot volumes healthy relative to perps? If outflows coincide with falling perp open interest (OI) and tepid funding, you’re more likely looking at genuine holding behavior than hedged flight.
- Realized P/L & Spending: Are sellers locking in losses (capitulation) or profits (distribution)? A drop in spent outputs at loss and a rise in coin dormancy support the accumulation case.
- Breadth & Correlation: Does strength extend beyond BTC, or is BTC soaking up flows while alts bleed? In early accumulation, breadth can be thin; as a breakout grows credible, leadership broadens.
- Macro Tape: Real yields, dollar index (DXY), and risk-asset tone matter. Outflows plus friendlier macro should carry more weight than outflows into a hawkish shock.
Microstructure Mechanics: Why Outflows Can Tighten the Spring
Think of an exchange book as a living organism with two vital signs: depth (how many coins sit at the top levels) and resiliency (how quickly depth refills when it’s consumed). Sustained outflows do two things. First, they reduce the number of resting asks from patient sellers—those willing to lighten up above market. Second, they slow the pace at which those asks refill after a sweep. The result is a spring that can snap faster on good news: when demand hits a thinner book, price can gap to the next pocket of supply before arbitrage closes it.
This dynamic explains why late-cycle upside moves often look stair-steppy: periods of quiet accumulation with modest outflows, then a news impulse (ETF flows, macro relief, corporate purchases) that jumps price multiple brackets, then another shelf of time-based digestion as participants rebalance.
What Would Confirm We’re in a New Uptrend
Outflows alone are not confirmation; they’re a context for confirmation. Here’s a pragmatic set of triggers that, when stacked, usually mark the transition from coil to breakout:
- Weekly Acceptance Above a Major Range: A weekly close above the prior distribution high, followed by a successful retest-and-hold on daily timeframes.
- Spot-Led Expansion: Rising spot volume outpacing perps during the first leg; neutral-to-modest funding (not overheated) as price pushes up.
- Declining Realized Volatility Before the Break: A classic pattern is volatility compression → expansion. If realized vol tightens into resistance and then expands upward, that’s a clean regime shift.
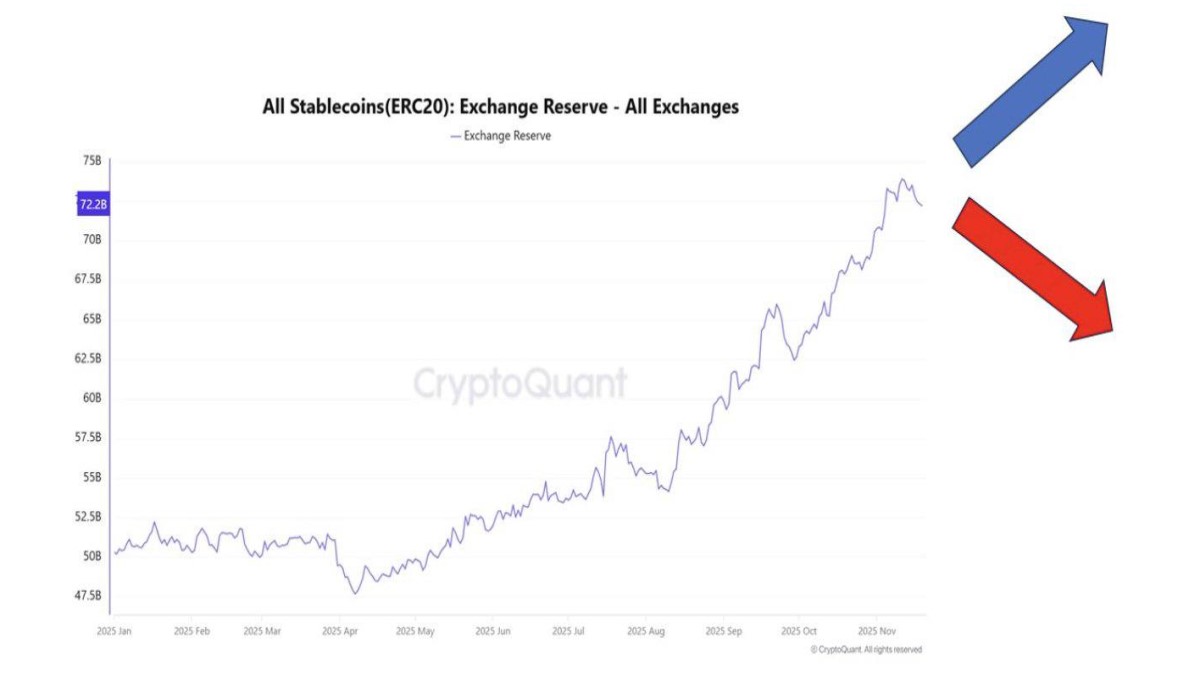
- Stablecoin Inflows: Aggregate stablecoin supply growing over 30 days and net CEX inflows flipping positive—fresh fuel entering the arena.
- Healthier Breadth, But Not Mania: BTC leads first; then ETH/BTC turns; then quality alts rise. A measured broadening, not an immediate meme frenzy, tends to be more durable.
Counter-Signals to Respect (Even If Outflows Persist)
- Funding Goes Hot Without Spot: If perps funding pops to persistently positive levels and spot lags, the move is leverage-driven and fragile.
- Sharp USD & Real Yield Rallies: A stronger dollar and rising real yields compress risk premia across assets; crypto rarely ignores that macro gravity for long.
- Return of Exchange Inflows on Rallies: If every green day is met by heavy deposits (profit-taking), the market is still in sell-the-rip mode.
- Derivatives Crowding: OI concentrated on a few venues with one-sided positioning can turn a benign pullback into an air pocket.
Three Scenarios for the Next 2–8 Weeks
- Base Case — Accumulation With Patience: Net outflows continue on a 30-day basis; BTC carves higher lows within a broad range; realized vol stays muted. ETH/BTC stabilizes but doesn’t rip. This is a builder’s market: time-based consolidation, selective entries on retests, de-emphasized leverage.
- Bullish Break — The Coil Releases: Weekly acceptance above the range highs with spot leading; stablecoin supply rises; funding stays tame. Alts participate selectively after a 1–2 week lag. Outflows prove to have been true accumulation.
- Head Fake — Outflows, Then a Macro Shock: Despite shrinking exchange balances, a hawkish surprise or risk-off wave hits. BTC rejects at resistance and slides back into range; inflows resume on red days as traders de-risk. The coil wasn’t ready; we return to mean-reversion tactics.
Investor & Trader Playbooks
For Long-Horizon Investors
- Dollar-Cost Emphasis: Use outflow periods to accumulate methodically instead of predicting exact breakout timing. Your edge is patience, not precision.
- Custody Discipline: If you believe outflows reflect better risk management, mirror it. Separate long-term holdings from trading stacks; keep cold storage truly cold.
- Event-Aware Sizing: Even in accumulation, macro events can cause air pockets. Maintain dry powder for forced-seller days; that’s where risk-adjusted entries live.
For Active Traders
- Respect the Range: If we’re still inside a multi-week range, buy the bottom third on confirmation and sell the top third; avoid breakout bias until weekly acceptance lands.
- Spot Over Perps (Early): In outflow regimes, the first leg often comes from spot. Use perps tactically and avoid paying rich funding for belief.
- Plan the Retest: If/when the breakout comes, your best add is usually the first clean retest that holds. Pre-write the level; don’t improvise.
How This Interacts With the Altcoin Question
When BTC is being withdrawn and dominance is steady or rising, capital is voting for quality and safety. Altseason doesn’t usually start in that environment; it starts when BTC ranges, ETH/BTC trends up, and liquidity begins to leak outward. If you’re alt-curious, think in lanes: keep a BTC-heavy core, a modest ETH sleeve that you scale only if ETH/BTC improves, and a small “explorer” sleeve for catalysts—but don’t confuse hope with structure. Outflows are a BTC story first.
Frequently Asked Questions
Q: If coins are leaving Binance, shouldn’t price already be mooning?
Not necessarily. Outflows are a supply-side story; price also needs a demand impulse. In early accumulation, price can grind or go sideways while the order book quietly thins.
Q: Could this just be Binance moving wallets?
Sometimes. That’s why you use labeled-cluster data and look for persistence across weeks. One gigantic transaction doesn’t equal organic accumulation; a month of net outflows across different addresses is harder to dismiss.
Q: Isn’t it possible funds withdrew to custodian accounts but opened shorts?
Yes. That’s why funding, basis, and OI composition matter. If hedging is heavy, you’ll see it in derivatives metrics. If those stay calm while spot leads, the bullish read strengthens.
Q: What’s the single most reliable confirmation?
No single metric. But a weekly close above the prior range highs with spot-led volume and neutral funding is a strong composite signal that the coil is releasing constructively.
Putting It All Together
Bitcoin leaving Binance on a sustained, 30-day basis is not noise. It’s a view into participant preference: fewer coins sitting on the immediate sell shelf, more in places that imply patience. Historically, that preference builds during the quiet middle of cycles—the stretches that feel boring until they suddenly don’t. But outflows are not destiny. A convincing transition from potential energy to kinetic trend still asks for spot-led breaks, disciplined derivatives, friendlier macro, and growing fuel from stablecoins. Until those arrive, treat the outflow as context for careful positioning: respect support, buy time-based dips, plan the retests, and keep your leverage light.
Note: This article is analysis and opinion for educational purposes only. It is not investment advice and does not recommend buying or selling any asset. Cryptoassets are volatile and carry risk, including loss of principal. Do your own research and use prudent risk controls.