
Open Interest Crashes to 2025 Lows: What Extreme Fear and Negative Funding Really Tell You
Bitcoin’s derivatives metrics occasionally reach levels that look shocking on a chart: open interest variation plunging, funding flipping sharply negative, and sentiment surveys flashing “extreme fear.” This article explains what those signals actually measure, how analysts typically interpret them, and why they never guarantee a specific outcome. It is meant as a guide to understanding the data, not as a trading checklist.
1. What Open Interest and “Open Interest Variation” Measure
Open interest (OI) is the total number of outstanding derivatives contracts (for example, perpetual futures) that have not yet been closed. When OI is high, there is a lot of leveraged exposure in the system. When it falls sharply, it usually means many positions have been unwound.
Open interest variation tries to capture how quickly that change is happening, often by comparing current OI to a rolling window or by normalizing moves relative to recent history. A deep, fast drop in OI variation is commonly associated with a “leverage flush” — a period when many traders are forced to exit losing positions.
2. Why a Leverage Flush Matters
In highly leveraged markets, the path of prices can be driven as much by who is forced to act as by any new information. When a sudden move hits:
- Stale long positions can be liquidated as margin requirements rise.
- Stop orders can be triggered in clusters, adding to selling pressure.
- Market makers may widen spreads until the volatility calms down.
Once that process has run its course, the market is often left with fewer leveraged players, and a greater share of risk carried by those who deliberately stayed or entered with stronger balance sheets. Historically, some strong rebounds have come after such clearing events — but not all deep drawdowns lead to quick reversals.
3. Negative Funding as a Sentiment Snapshot
On perpetual futures, funding rates are periodic payments between long and short positions. When funding is positive, longs are paying shorts; when funding is negative, shorts are paying longs.
Extended periods of negative funding usually mean that short positioning has become crowded and that many traders are willing to pay an ongoing cost to hold bearish exposure. From an educational perspective, this tells you that:
- Market sentiment has turned cautious or outright fearful.
- The marginal trader is paying to maintain a negative view.
- Any sharp change in conditions could impact those positions rapidly.
However, negative funding alone does not say when such positioning might change, or in which direction prices will ultimately move.
4. Putting the Signals Together — Without Treating Them as Commands
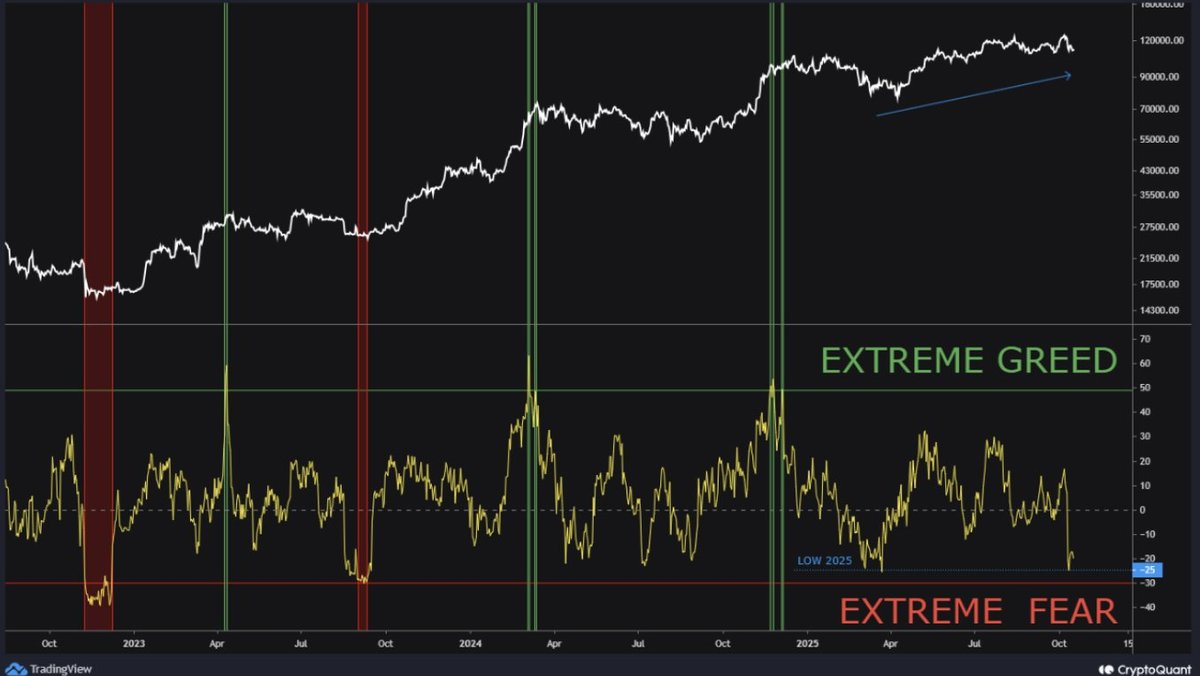
When open interest has fallen to unusually low levels and funding is negative and sentiment surveys show extreme fear, analysts generally draw one broad conclusion: a lot of leveraged long positions have already been washed out, and bearish views are popular. This describes a state of the market, not an automatic buy or sell signal.
Some of the questions that professional observers ask in such conditions include:
- Is the remaining trading activity driven more by spot markets or derivatives?
- Are large flows dominated by long-term holders, new entrants, or fast-moving speculative accounts?
- Do liquidity conditions (spreads, depth, and slippage) look healthy enough to handle sudden changes in demand?
5. Historical Patterns and Their Limits
In past cycles, some of the largest future uptrends were preceded by periods of very negative sentiment and aggressive deleveraging. But history does not repeat in a mechanical way. Important differences across episodes include:
- The macro environment: interest rates, liquidity conditions, and risk appetite across other asset classes.
- Microstructure: the share of volume on derivatives vs spot exchanges and the role of large institutions.
- Positioning starting points: whether leverage was already elevated or modest before the flush.
For that reason, charts of prior cycles should be treated as context, not as templates for future price paths.
6. Risk Factors That Can Change the Picture
Even when leverage appears to have been reset, several things can still disrupt or delay any recovery in market conditions:
- Fresh macro shocks: new policy announcements, geopolitical surprises, or liquidity events in traditional finance.
- Liquidity gaps: thin order books during off-hours can amplify price moves and create outsized candles.
- Re-leveraging too quickly: if open interest rebuilds rapidly without a change in underlying demand, the market can once again become fragile.
7. How to Read These Metrics as a Student of the Market
If you are learning about crypto derivatives, metrics like open interest and funding can be useful in several educational ways:
- They help describe who is taking risk (spot holders vs leveraged traders) and how that mix changes over time.
- They provide clues about the health of market structure, such as whether liquidity is broad-based or concentrated.
- They remind you that price moves are shaped by position management, not only by headlines.
Used this way, the data becomes a tool for understanding the system rather than a set of step-by-step instructions.
Disclaimer: This article is for informational and educational purposes only and does not provide financial, investment, or trading advice. Nothing here should be interpreted as a recommendation to take any particular position in any asset or derivative. Crypto markets are volatile and complex; always do your own research and consider consulting qualified professionals before making financial decisions.


