‘Only Two Million Left’? What Low Exchange Balances Actually Mean
The headline claim is eye-catching: Bitcoin balances on centralized exchanges (CEXs) have fallen toward multi-year lows, with some dashboards estimating only ~2.0–2.4 million BTC sitting in known exchange clusters. That’s the float most readily available to fill market-buy orders. Several independent sources confirm the directional trend. For example, a mid-2025 roundup noted that balances shrank from ~3.3 million BTC in early 2024 to roughly ~2.3 million by May 2025, a ~30% drawdown in a year and a half. ([The Coin Republic][1]) In parallel, Glassnode’s weekly market commentaries and datasets through 2025 have repeatedly characterized the share of supply on exchanges as hovering near cycle lows—consistent with investors self-custodying and ETFs warehousing coins through authorized participants. ([X (formerly Twitter)][2])
However, converting those snapshots into a single, precise percentage can be slippery. One often-quoted figure asserts that only ~9–10% of all coins remain on exchanges. That ratio depends on how you define the denominator (circulating vs. issued vs. ‘free float’) and the numerator (which exchange addresses are correctly tagged; whether custodians count as exchanges; and how wrapped/bridged BTC is treated). In July 2025, a summary of Glassnode data put the exchange-held share closer to the mid-teens (~14–15%), which is still a near seven-year low but notably higher than sub-10% soundbites. ([Binance][3]) The reconciliation is straightforward: methodologies differ, and the absolute numbers move as clusters are re-tagged. The robust takeaway is the direction and the regime—
Why Scarcity at the Margins Moves Price Disproportionately
Price does not depend on total supply; it depends on marginal tradable supply meeting marginal new demand. When a thick layer of coins sits in cold wallets (ETFs, long-term holders, corporate treasuries) and the exchange float thins, each dollar of new spot demand pushes higher up the order book. That convexity is the heart of the ‘supply shock’ thesis. The lesson goes back to every historic impulse move: it wasn’t that the world suddenly forgot the 21M cap—it was that the sellable float grew tight just as a new, persistent source of demand arrived.
In 2025, three demand engines dominate the conversation:
1. U.S. spot ETFs and global look-alikes. Creation baskets vacuum coins from OTC desks and custodian inventory; when net creations exceed redemptions, ETF plumbing locks up supply in vehicles that rarely day-trade. Net inflows add structural bid; net outflows do the opposite.
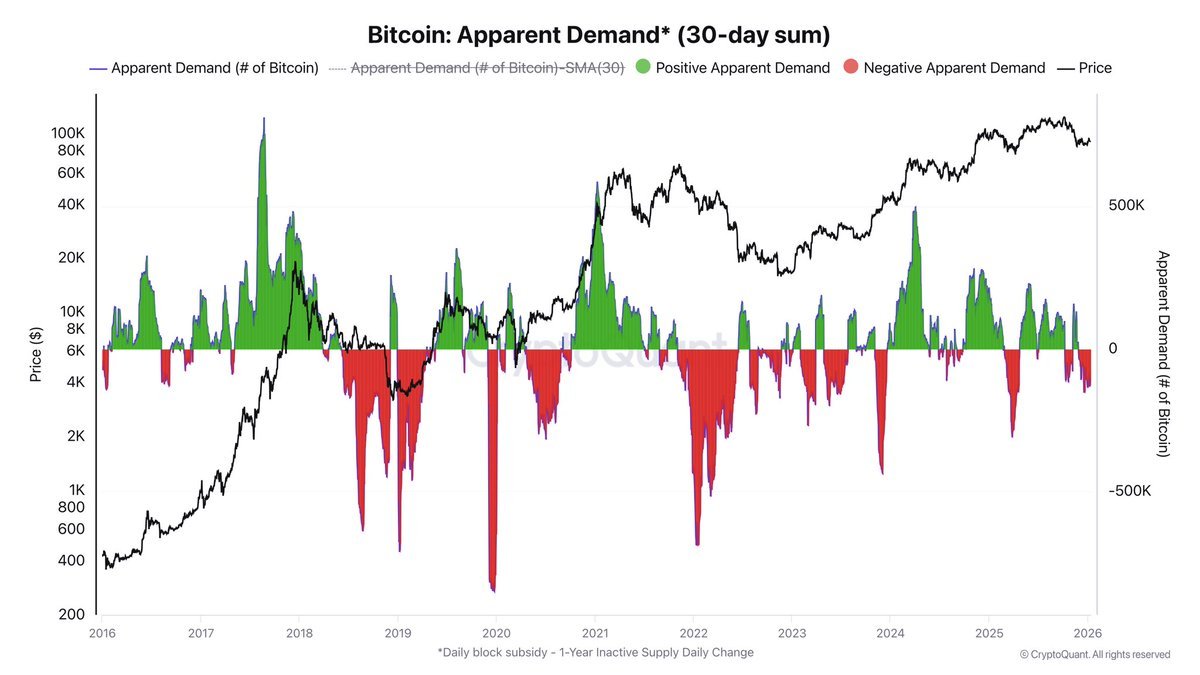
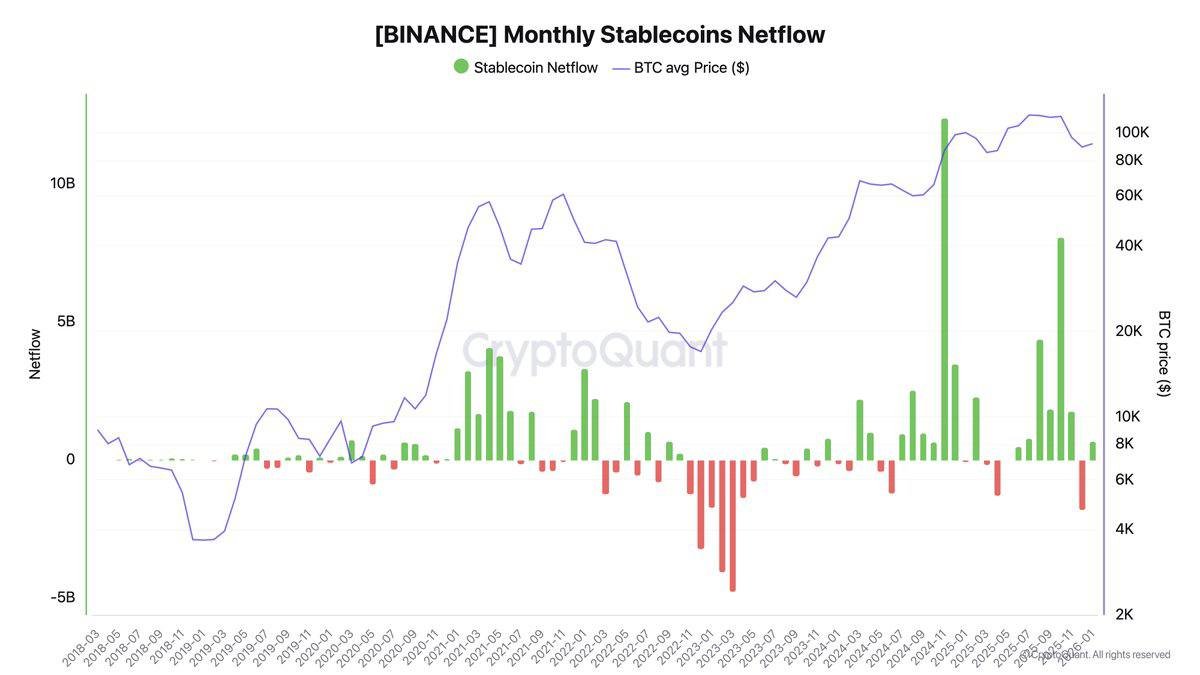
2. Stablecoin issuance. Fresh USD-equivalent liquidity (USDT, USDC and peers) tends to lead spot crypto purchases by days or weeks. A visible mint cycle often foreshadows risk-on appetite. Recent examples: on selected 2025 episodes, daily net inflows into stablecoins signaled a thaw before BTC rebounded. ([TradingView][4])
3. Self-custody culture. Coins leaving exchanges into long-term storage reduce immediate sell pressure and elastic supply. While some dormant wallets do wake up—2025 saw publicity around 2011-era balances moving—the larger trend still tilts toward illiquidity, not churn. ([MarketWatch][5])
Put differently, scarcity is amplifier, not spark. It’s the microphone, not the singer.
Is $150,000 Justifiable on Scarcity Grounds Alone?
Let’s decompose the $150k target into a simple supply-demand frame. Assume exchange-visible float is ~2.2M BTC (midpoint of 2.0–2.4M estimates) and that at least half of that is
There are two common pitfalls when translating scarcity into price targets:
- Ignoring substitution channels. A thinner CEX float can be offset by OTC block liquidity (miners, treasuries, whales) or by cross-venue rotation (derivatives basis unwinds, borrow-lend inventory). Scarcity on one venue cluster is not scarcity in the entire market.
- Forgetting that ‘scarce’ assets swing both ways. When the float is tight, negative demand shocks (ETF redemptions, risk-off in macro) punch just as hard. The same convexity that makes upside rips violent can deepen downdrafts.
In other words: $150k is plausible under a regime where demand vectors align for several weeks, but scarcity alone does not mint new highs on autopilot.
Reconciling Conflicting Numbers
You may encounter three flavors of metrics in posts and dashboards:
1. “Coins on exchanges” (absolute). Aggregates tagged exchange addresses. Estimates range ~2.0–2.4M BTC as of late 2025, down from >3M in 2024. ([The Coin Republic][1])
2. “% of supply on exchanges.” Depends on denominators and tagging. Some summaries showed ~14–15% mid-2025 (lowest in ~7 years), not sub-10%. ([Binance][3])
3. “Illiquid supply / long-term holder supply.” Measures coins held by entities with a low propensity to sell. These series trend up during accumulation waves and fall when old coins are spent. Glassnode’s weekly notes through 2025 frame these dynamics alongside ETF flows and miner behavior. ([X (formerly Twitter)][2])
None of these series are ‘wrong’; they answer different questions. The investor mistake is to cherry-pick the lowest percent headline and assume it’s gospel. A range-aware reading is more realistic—and more actionable.
The Micro-Plumbing Behind a Supply Shock
Supply shocks rarely begin on a daily chart; they begin in the pipes:
• ETF primary markets. When a fund trades at a premium to NAV and primary brokers create new shares, coins are sourced from custodians and OTC desks. Persistent creations tighten the on-exchange float as bots refill inventory with difficulty.
• Derivatives basis. When funding flips positive and the cash-and-carry spread widens, basis traders warehouse spot BTC versus short perps/futures. That inventory is temporarily removed from the net offer.
• Stablecoin corridors. If USDT/USDC outstanding expands meaningfully, CEXs and market makers front-run future buys; you’ll see books skew and the top-of-book elasticity shrink.
• Miner hedging cadence. Post-halving, miners may sell forward hash-price or draw on credit rather than dumping spot. In contrast, stress episodes force pre-sold inventory to be delivered, softening squeezes.
Elasticity is the unglamorous protagonist: how many coins are actually for sale at each $1,000 up the ladder? A thinner ladder means a smaller dollar bid traverses more price levels.
Three Scenarios from Here
1) Structural Squeeze (Probability 35–40%)
Setup. ETF creations turn net-positive for several consecutive weeks, the stablecoin base grows, and exchange balances grind lower or flatline near the lows. Derivatives open interest rises but remains under-hedged; funding is healthy, not euphoric. Macro stays benign (real yields slip, credit spreads stable). Path. BTC chews through $110–$125k on a series of higher lows; sellers are mostly tactical. By the time a late-cycle retail wave arrives, the books are thin and every $1 of net demand moves price outsized. Outcome. Prints into the $140–$155k band are plausible without absurd leverage, provided ETF creations and stablecoin issuance keep supplying the buyer side. This is the textbook supply-shock arc.
2) Whipsaw & Drift (Probability 40–45%)
Setup. Exchange balances remain low, but ETF flows chop between small creations and redemptions. Stablecoin issuance meanders. Macro is mixed: occasional risk-off days around policy headlines offset tech-led risk-on. Path. Price spikes on thin books, squeezes shorts to $120k+, then mean-reverts as demand fades. Exchange reserves do not rise much, but neither do they fall; on-chain ‘illiquid supply’ grows slowly. Outcome. $150k becomes a stretch unless a fresh demand impulse appears (e.g., sovereign or corporate balance-sheet buys). The market prints several failed breakouts before building a sturdier base.
3) Scarcity Meets Soft Bid (Probability 15–25%)
Setup. Macro turns risk-off (higher real yields or growth scare). ETF outflows persist for a spell; stablecoins contract. Miners deliver pre-sold inventory, and some long-term holders spend into strength to rebalance. Path. Even with a thin float, a net-sell regime pushes price lower in steps; the same convexity works in reverse. Exchange balances tick up as coins return to meet bids. Outcome. $150k is deferred. The supply-shock meme survives but needs a new demand driver to revive.
What Would Confirm the Bullish Version?
Four simple tells would make the supply-shock case more than a slogan:
1. ETF net creations are steady. Daily prints in the green for several weeks, not one-off. Disclosures from major funds (and 13F peeks into large holders) help corroborate true participation—not just hot money. ([X (formerly Twitter)][2])
2. Stablecoin base expands. Track net issuance across top stables; an accelerating slope is the lifeblood of spot demand. ([TradingView][4])
3. Exchange balances stay pinned. The float does not refill on rallies; coins keep moving to custody instead.
4. Order-book elasticity deteriorates. Practical, but visible: thinner top-of-book, larger gaps between size pockets, more slippage per unit notional.
Where Supply Shock Stories Go Wrong
Investors make three recurring mistakes when scarcity narratives trend on social media:
• Equating “coins on exchanges” with “coins for sale.” A chunk of exchange balances are internal (MM inventory, hedges, collateral) or earmarked (ETF flows). Conversely, many coins off-exchange can be mobilized quickly via OTC if price is attractive. The real float is dynamic.
• Assuming dormant coins are universally bullish. ‘Ancient’ wallets waking up can be neutral or bearish depending on the venue (OTC vs. CEX), but their occasional movement is a reminder that not all cold storage is sacred. 2025 saw a few headline-grabbing resurrections; so far, most did not translate into observable dump events. ([MarketWatch][5])
• Forgetting that leverage changes everything. If perps funding runs hot, a thin float turbocharges upside until a wick cleans leverage out. Sustainable advances prefer spot-led demand—ETFs, treasuries, stables—over perpetuals froth.
Modeling the Math Behind $150k
Consider a stylized three-month window. Suppose exchange-visible BTC hovers near ~2.2M. Assume 40–50% is locked for operational or hedged purposes, leaving ~1.1–1.3M as effectively elastic. To propel BTC from ~$100k to ~$150k, historical depth studies suggest $20–$35B of net spot demand, given current order-book conditions and cross-venue spillovers. That demand could be funded by: (a) consistent ETF creations of ~$300–$500M/day over several weeks; (b) a $5–$10B expansion of the top two stablecoins, correlating with increased spot risk appetite; and (c) incremental corporate/sovereign accumulators. If these arrive together, the path compresses. If any leg lags (e.g., ETFs flatline), the path elongates or stalls. None of this requires blow-off leverage; in fact, it works best without it.
What Could Break the Thesis
Three risks deserve respect:
- ETF outflows or regulatory frictions. Redemption waves refill the float and sap the marginal bid. A single large day of outflows can reverse a week of spot creations.
- Macro liquidity turns. Rising real yields or a global growth scare crimp risk appetite. BTC can decouple for short bursts, but over multi-week horizons it still ingests macro impulses.
- Refill risk. On sharp rallies, some long-term holders and miners sell into strength, partially refilling exchange balances. Scarcity then softens just when the market expects an air-pocket higher.
Investor’s Checklist for the Next 30–60 Days
To avoid trading a slogan, watch the plumbing:
1. ETFs: Are creations outpacing redemptions on a rolling 5–10 day basis? Which funds lead? Are creations coming alongside rising AUM, or just price beta? ([X (formerly Twitter)][2])
2. Stablecoins: Is the aggregate market cap rising decisively, not just rotating among issuers? Are mints broad-based? ([TradingView][4])
3. Exchange balances: Are coins continuing to leave on green days, or do we see re-deposits on strength?
4. Derivatives: Is funding stretching, and is OI climbing faster than spot? If yes, expect whipsaws.
5. Miner flows: Are reserves stable and selling muted relative to hash-price stress?
Bottom Line
Bitcoin’s on-exchange float is genuinely thin versus prior cycles—that much is clear across multiple trackers. ([The Coin Republic][1]) Thin float is the accelerant; it’s not the spark. A sustained drive to $150,000 asks for persistent net spot demand—most credibly from ETF creations and renewed stablecoin issuance—arriving into that tight float while sellers remain patient. If those pieces click, scarcity will do what scarcity always does: translate modest buying into disproportionate price travel. If they don’t, the same scarcity can amplify downside when the bid steps away. Read the pipes, not the posts.


