
Reading the Chart You Posted: What the Colors Mean
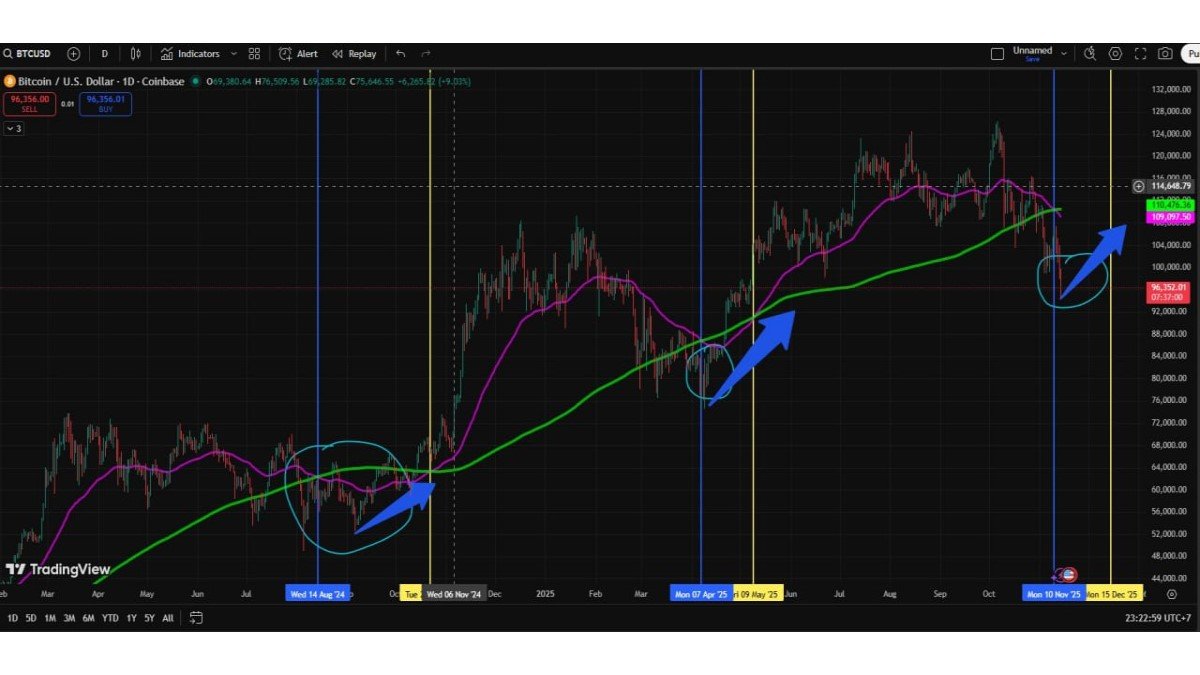
The chart highlights three anchor elements and two vertical event markers. The green curve is the 200-day EMA (the slow trend filter); the magenta curve is the 55-day EMA (the fast momentum gauge). Blue vertical lines label prior death crosses (55 below 200) and the most recent one; yellow vertical lines label subsequent heaven crosses (55 back above 200). The blue circles emphasize the panic-lows that often print within days to weeks of a death cross; the arrows then trace the relief leg that follows. On the far right, the circle at sub-100k reflects the current event: a selloff into (and just after) the cross.
Three observations jump off the chart:
1. Death crosses are lagging indicators. They don’t predict weakness—they confirm that weakness already dominated for weeks. By the time the fast average slides under the slow one, a substantial portion of the drawdown has occurred, positioning is cleaner, and late sellers are loudest.
2. The first relief thrust typically aims at the fast average. Your annotations rightly note that the first high-probability move after panic is a reclaim attempt of the 55-EMA. In prior instances, the market overshot that average, paused, and then retested it from above.
3. When recovery is successful, a ‘heaven cross’ follows quickly. Once price lives above both EMAs and the 55 turns up, the crossover back above the 200 tends to occur on compressed timelines later in the cycle.
Why a Bearish Signal Can Birth a Rally
It sounds paradoxical, but a bearish cross can set the table for gains. The reason is market structure:
• Trend filters are slow by design. EMAs weight recent data more than SMAs, but a 200-day lookback still embeds half a year of trades. Pushing the 55 under the 200 requires weeks of selling; when it finally flips, the incremental supply often dries up.
• Crowding effect. A visible ‘death cross’ headline recruits late shorts after an already significant move. If spot demand reappears, these shorts become fuel.
• Volatility clustering. Deep pullbacks lift realized volatility, which attracts tactical players hunting mean reversion. Their bids are not conviction—yet—but they accelerate the first impulse up to the 55-EMA.
The Late-Cycle Twist: Speed
Early in cycles, it can take months for a down-cross to morph into an up-cross. In late cycles, liquidity is concentrated, venues are deeper, and narrative transmission is instant. That combination shortens the distance between panic lows and structural recoveries. The upshot: the window to build positions is narrower, and the penalty for hesitation is higher—if confirmation appears.
Key Levels from the Current Map
We work with zones, not single ticks:
• Shock Low Zone: the wick low carved around the death-cross event. It is where capitulation and fear peaked. A daily close back below that zone invalidates the recovery script.
• 55-EMA Reclaim Band (~108–110k by your chart): this is the first magnet on relief. The script you outlined—thrust to roughly 112–116k, then a test back toward ~109k (fast average)—is consistent with prior episodes.
• 200-EMA and Overhead Cluster: The slow average will flatten then gently slope down. Once the 55 lifts above it, we enter a different regime: pullbacks into the 55 tend to be bought, and the ‘heaven cross’ gets traction.
Signals That Differentiate a ‘Real’ Turn from a Dead-Cat Bounce
Because EMAs are price-derived, you need non-price confirmation. Our checklist:
1. Funding & Basis: Deeply negative funding combined with a perps discount that narrows as spot rallies is constructive (shorts covering + real buying). Negative funding that stays negative while spot stalls is not.
2. On-Exchange Stablecoin Balances: This is dry powder. Rising balances during the relief leg suggest firepower. Falling balances say the bounce is redistribution.
3. ETF / Wrapped Vehicle Flows (if available to your venue): Counter-cyclical net inflows on red days are the best friend of sustainable recoveries.
4. Breadth: In true turns, the advance-decline line across large caps improves and ETH/BTC stabilizes. If breadth remains narrow and ETH bleeds vs. BTC, you’re seeing a defensive rally.
A Back-of-the-Envelope Anatomy of the Pattern
Historically, the sequence around a death cross that turns into a heaven cross looks like this:
- Shock. Price slices under both EMAs; fear spikes; perps funding flips negative; volume is sell-dominated.
- Reflex. Price springs back to the 55-EMA; shorts reduce; basis normalizes. This is the 112–116k thrust in your sketch.
- Check. A pullback tags or slightly undercuts the reclaimed 55-EMA (say, a check in the 108–110k belt) and holds a higher low versus the shock.
- Transition. The 55-EMA turns up, crosses the flattening 200-EMA—the heaven cross—while breadth widens.
In late-cycle tapes, Steps 1–4 can compress into 3–6 weeks. That speed is why pre-defined risk frames matter.
Trading the Setup: A Professional’s Risk Plan
This is not financial advice—it’s a process. We split the approach into three tranches:
• Tranche A: Probe after reversal trigger. The trigger is a daily close above the 55-EMA on rising spot volume with less negative funding. Size small (25–35% of intended risk), place a stop under the death-cross low wick (or a volatility-adjusted ATR multiple below the 55).
• Tranche B: Confirmation add. Add when the first higher low is printed and the back-test of the 55 holds on an intraday sweep. Funding should be drifting toward neutral; breadth should be improving.
• Tranche C: Structural add. Add on a decisive break and hold above the 200-EMA or on the cross itself if flows corroborate (ETF net buys, rising stablecoin balances). This tranche has the tightest invalidation (lose the 55 on a closing basis, trim fast).
Targets & Management. First objective: 112–116k (into the 55-EMA overshoot and prior supply). Take a third off there in fast tapes; let the pullback to ~109k test the 55. If it holds, trail stops under prior swing lows and let the position run into the heaven-cross window. Should the reclaim fail, step aside: in late cycles, failed reclaims can unwind brutally.
What If It Fails? The Bearish Mirror
Technical analysis is conditional. If BTC cannot close above the 55-EMA within a reasonable window and instead prints lower highs beneath a falling 55 while funding creeps back to positive (longs paying), the market is distributing. In that regime:
- Expect a range between the death-cross low and the 55-EMA cap to persist.
- Breakdown triggers sit at the wick low; a decisive daily close below that low opens risk to the next liquidity shelf (prior multi-month demand). Don’t guess—react.
- Altcoins underperform; ETH/BTC stays heavy; breadth deteriorates.
EMA Mechanics: Why We Use 55 and 200
The 200-EMA is the consensus secular filter. The 55-EMA (roughly a quarter of a year of trading days) captures swing momentum without being hyper-noisy. EMAs—unlike SMAs—weight the most recent closes more, making them faster. That faster response is useful in crypto, where regime shifts happen quickly. The trade-off: more whipsaws. That’s why we never trade the cross in isolation—we use it as a context, then require flow confirmation.
Confluence Tools to Add Confidence
To keep the analysis professional and not merely visual, layer in three confluences:
- Market profile / volume shelves. Identify high-volume nodes near 109k and 112–116k. If the relief thrust accepts above a node (multiple closes in that region), the odds of continuation rise.
- Realized volatility bands. Bollinger or Keltner channels often contract during base-building. A successful reclaim sees bands expand upwards with price above the middle band.
- Time symmetry. Measure the number of sessions between the prior yellow and blue lines. Late-cycle moves often complete in fractions (1/2, 2/3) of prior durations. This isn’t deterministic, but it helps frame expectations.
Macro Context: Why Liquidity Matters More Than Ever
Even the cleanest chart works inside a macro aquarium. The pillars that will either turbocharge or smother the heaven-cross script are:
- Policy expectations. As rate-cut odds ebb and flow, front-end yields move and risk appetite adjusts. Crypto trades like a high-beta duration asset when the policy path is uncertain.
- Regulated wrapper flows. If spot ETFs/ETPs see persistent redemptions, the path higher is uphill. If they absorb dips, the 55 reclaim becomes easier.
- Stablecoin float. Expanding float is a necessary (not sufficient) precondition for sustained uptrends. Watching issuance and exchange balances keeps you honest.
Scenarios From Here (With Tells)
1) Fast Reclaim & Heaven Cross (Probability 40%)
Path: BTC springs toward 112–116k within one to two weeks, quickly checks 108–110k, holds, then grinds higher. Breadth improves; ETH/BTC stabilizes; funding normalizes from negative to neutral. A heaven cross prints soon after as the 55 turns up and crosses the flattening 200. Tells: Rising on-exchange stablecoin balances; ETF net buys on down days; narrowing spreads on majors.
2) Range & Patience (Probability 40%)
Path: BTC chops between the shock low and the underside of the 55-EMA for several weeks. Each push fizzles as flows remain tepid. This environment mints false breakouts and punishes impatience. Tells: Funding oscillates around zero; basis stays muted; breadth remains mediocre; ETH/BTC drifts sideways.
3) Failed Reclaim & Lower Lows (Probability 20%)
Path: Attempts to clear the 55-EMA fail; funding flips positive despite weak price (deceptive longs), then the wick low gives way and triggers stops. Dominance jumps as alts underperform sharply. Tells: Shrinking stablecoin float; persistent ETF outflows; increasing exchange BTC balances; term structure of volatility stays inverted.
Positioning for Builders, Traders, and Long-Only Allocators
• Builders: Volatile weeks are the best time to report transparently—treasury runways, protocol fees, security posture. Clarity attracts sticky capital when beta is shaky.
• Discretionary traders: Let the 55-EMA be your line in the sand. Trade the reclaim + retest with defined risk rather than guessing the exact low. Use options (put spreads/collars) to stay long core while hedging tails.
• Long-only allocators: Ladder buys over time around structural levels (55 reclaim, 200 reclaim) and rebalance if BTC outruns EMAs by >2 standard deviations; late-cycle tapes reward discipline more than bravado.
Common Mistakes Around Death/Heaven Crosses
- Trading the cross itself. The cross is information about trend maturity, not a timing tool. Entries should be tied to reclaims, retests, and flow confirmation.
- Ignoring invalidation. If price loses the shock low on a closing basis, the setup changed. Don’t negotiate with it.
- Over-sizing alt exposure before breadth turns. If BTC dominance is rising and ETH/BTC is falling, the market is not ready for broad beta.
Bottom Line
The 55/200 EMA death cross you flagged has indeed marked fear peaks in prior swings. In late-cycle dynamics, those signals can flip into upside quickly—if and only if capital returns and breadth improves. The cleanest path is the one you outlined: a burst to 112–116k, a check toward ~109k (55-EMA), and continuation into a heaven cross. Respect the process: watch funding and basis, watch stablecoin float, watch regulated flows, and let the 55 reclaim guide risk. In choppy water, it’s not the headline that saves you; it’s your plan.


