Altcoins 2025 – A Data-Driven Outlook With Specific Price Targets
This rewrite turns the usual platitudes into a decision framework. Below you’ll find: (1) a transparent model for how we generate price ranges, (2) sector-by-sector theses with explicit 2025 targets and cycle-peak ranges where relevant, (3) catalysts and invalidations you can actually track, and (4) a portfolio playbook. All projections are scenario-based, not promises; use them to structure risk, not to outsource it.
How We Forecast: The 5-Pillar Model
Price targets are derived from a weighted composite of five drivers. We publish the assumptions so you can adjust them to your own view.
- BTC Regime (25%) — Altcoin USD returns are path-dependent on Bitcoin. We bucket 2025 into three paths: range (BTC $55–85k), advance ($85–120k), and euphoria ($120–150k). Each path shifts altcoin beta and the attainable multiples on revenues/fees/TVL.
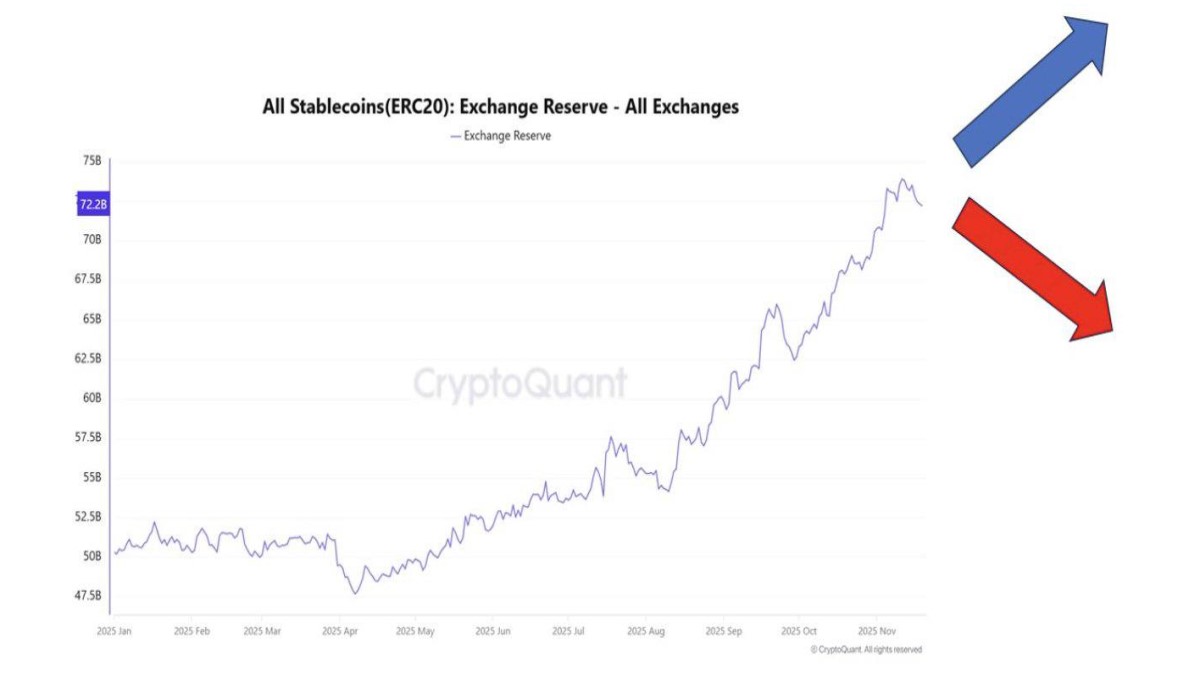
- Liquidity & Stablecoins (20%) — A rising aggregate stablecoin float and net CEX outflows of BTC (accumulation) historically precede alt rotations. We proxy this with a 30–90 day trend assumption for stablecoin supply growth (flat / +5% / +10%).
- Dominance & Breadth (20%) — We track BTC dominance and ETH/BTC. Targets expand only if BTC dominance stalls or retreats and ETH/BTC stabilizes or grinds higher; otherwise we haircut alt ranges by 20–40%.
- On-Chain/Usage (20%) — Fees, active addresses, TVL, and protocol-specific volumes. We translate these into rough revenue/usage bands, then apply sector-appropriate multiples (infra > DeFi > consumer).
- Microstructure (15%) — Listings quality, order book depth, perp funding/OI composition. We favor spot-led pushes over perp-only squeezes. If funding runs hot without spot, we haircut upside and widen downside.
Methodology note: We present EOY-2025 targets and a cycle-peak band (most likely 2026–27) when helpful. Numbers are rounded ranges, not single-point predictions. Where a project’s data is unusually noisy or supply opaque, we label ranges as higher variance.
Macro & Market Assumptions for 2025
- Base macro: Disinflation drifts, no deep recession; real yields range-bound. Risk premium compresses modestly versus 2024–early 2025.
- Crypto structure: Spot BTC/ETH continue broad institutionalization; stablecoin supply resumes gradual growth; L2 throughput rises; alt breadth improves late in the year if BTC consolidates after advances.
- Regulation: No blanket bans; continued case-by-case actions. Compliance rails (KYC’d on/off-ramps, proof-of-reserves) expand rather than contract.
Top-Down Calls (2025)
- ETH leadership before full alt breadth: A weekly ETH/BTC higher low tends to precede DeFi and infra rotations by 2–6 weeks.
- AI & RWA remain the highest narrative beta (supply permitting). AI compute tokens with visible revenue or staking sinks can outpace the market late-cycle; RWA/treasury-on-chain tokens track rates and compliance wins.
- DeFi re-rates if fee capture becomes rule-based (buybacks, revenue share) and if stablecoin float grows; otherwise it mean-reverts.
- L2 tokens are quality cyclicals, but the upside is capped if token value capture remains indirect; renewed fee routing or staking utility could unlock a multiple re-rate.
Sector Theses & Explicit Targets
Below, we group representative assets by sector. If your favorite isn’t listed, map it to the closest sector and apply the same logic. All targets assume the Base/Advance BTC paths; if BTC enters euphoria, expand the upper bands by ~20–30%. If BTC ranges <$70k most of the year, trim the high end by ~20%.
Layer-1 / Smart-Contract Platforms
- Ethereum (ETH): EOY-2025: $4,800–$6,500. Cycle peak: $8,000–$12,000. Catalysts: rollup economics, L2 fee compression with value routed to ETH (burn/staking), ETF-driven flows. Invalidations: sustained ETH/BTC downtrend, L2 alt-fee leakage without ETH accrual.
- Solana (SOL): EOY-2025: $180–$320. Cycle peak: $300–$500. Catalysts: throughput + consumer apps; stable DePIN/AI integrations; consistent uptime through high vol. Risks: validator centralization debates, fee market stability.
- Cosmos-stack leaders (ATOM and app-chains): EOY-2025: ATOM $12–$25 (higher variance). Catalysts: shared security adoption; IBC-native RWAs; clearer value capture to ATOM. Risks: persistent value leak to app tokens; governance fragmentation.
Layer-2 / Scaling Tokens
- Arbitrum (ARB): EOY-2025: $1.60–$3.20. Cycle peak: $2.50–$5.00. Catalysts: sequencer fee routing / staking; mega-apps (perps, games) with sticky volumes. Risks: issuance headwinds; lack of direct value capture.
- Optimism (OP): EOY-2025: $2.00–$4.50. Cycle peak: $3.50–$7.00. Catalysts: OP Stack adoption (superchains) with fee/share clarity. Risks: token incentives without durable fee tie-ins.
DeFi (DEX, Lending, Derivatives)
- Uniswap (UNI): EOY-2025: $6–$12. Peak: $10–$20. Catalysts: fee switch clarity; cross-L2 routing; intent-based swaps. Risks: fee-switch delays, forks with better value capture.
- Aave (AAVE): EOY-2025: $120–$220. Peak: $180–$360. Catalysts: RWAs as pristine collateral; risk engine advances; GHO adoption. Risks: smart-contract incidents; collateral stress.
- Perps venues (e.g., GMX-like): Targets vary widely; use fee multiples (6–12× annualized net fees) to anchor, with a haircut when incentives dominate volumes.
AI / Compute & Data
- Render / GPU marketplaces (RNDR-like): EOY-2025: $6–$12. Peak: $10–$20. Catalysts: real client spend, verifiable supply, and creator-side UX. Risks: off-chain competitors; thin on-chain demand.
- AI knowledge/agent networks (TAO-like): EOY-2025: high variance; treat via FDV guardrails (see table). Catalysts: revenue share, staking sinks; enterprise pilots. Risks: unverifiable usage claims; emission overhang.
RWA (Real-World Assets)
- Tokenized treasuries / credit (ONDO-like): EOY-2025: $0.90–$1.80. Peak: $1.50–$3.00. Catalysts: custody/reg clarity; integration into major wallets/fintech flows. Risks: regulatory delays; concentration in a few custodians.
Oracle / Data Infra
- Chainlink (LINK): EOY-2025: $18–$35. Peak: $30–$55. Catalysts: CCIP adoption, RWA/pricing feeds at scale, fee share to stakers. Risks: slow enterprise conversion; staking APR compression without volume lift.
Target Table (Quick Reference)
| Asset / Sector | EOY-2025 Target | Cycle-Peak Band | Catalyst to Watch | Key Invalidation |
|---|---|---|---|---|
| ETH (L1) | $4.8k–$6.5k | $8k–$12k | ETH/BTC trend, L2 fee routing | Weekly ETH/BTC breakdown |
| SOL (L1) | $180–$320 | $300–$500 | Uptime in high vol, consumer apps | Relapse of outages / fee spikes |
| ATOM (L1 hub) | $12–$25 | $20–$40 | Shared security, accrual redesign | Value leak to apps persists |
| ARB (L2) | $1.6–$3.2 | $2.5–$5.0 | Sequencer value share | Ongoing issuance overhang |
| OP (L2) | $2.0–$4.5 | $3.5–$7.0 | OP-Stack fee tie-ins | Token incentives w/o accrual |
| UNI (DEX) | $6–$12 | $10–$20 | Fee switch clarity | Governance stalls fee share |
| AAVE (Lending) | $120–$220 | $180–$360 | RWA collateral, GHO | Collateral stress event |
| RNDR (AI GPU) | $6–$12 | $10–$20 | Real client demand | Off-chain competition wins |
| ONDO (RWA) | $0.90–$1.80 | $1.50–$3.00 | Custody/reg wins | Policy roadblock |
| LINK (Oracle) | $18–$35 | $30–$55 | CCIP + RWA feeds at scale | Slow enterprise adoption |
Scenario Map (How 2025 Might Actually Trade)
1) Base Case — “Advance, Then Range” (Probability: 50%)
BTC advances toward six figures in H1/H2, then ranges; ETH/BTC stabilizes; stablecoin float grows modestly. In this path, the upper half of our EOY-2025 targets is reachable for ETH/SOL/LINK, mid-bands for DeFi/L2s. Breadth improves gradually in Q4 as BTC cools.
2) Bull Case — “Euphoria Late” (Probability: 30%)
BTC breaks decisively higher; funding remains mostly neutral as spot leads; stablecoin supply jumps >10% Q/Q. Add 20–30% to upside bands. Historically this is where late-cyclical AI/RWA names overshoot. Risk: fast corrections after overextension.
3) Bear Case — “Range <$70k” (Probability: 20%)
Macro wobbles or policy shock keep BTC stuck; ETH/BTC fails to base; stablecoin float flattens. Trim high bands by ~20% and expect mean-reversion regimes. Keep exposure in higher-quality L1/L2 and fee-proven DeFi; avoid illiquid narratives.
Catalysts & Invalidation — What to Watch Weekly
- ETH/BTC: We need a weekly higher low and reclaim of the prior breakdown shelf for sustained alt beta. A failure here caps all alt ranges.
- Stablecoin supply & flows: A persistent rise in aggregate float plus net CEX BTC outflows supports accumulation and alt rotations. A stall or contraction implies tighter upside.
- Spot vs. perps leadership: Early legs should be spot-led. If funding runs hot while spot lags, fade strength or reduce size into rips.
- On-chain usage: Track fees/TVL/DAU for the sector you’re targeting (DeFi, AI compute, RWA payouts). Targets are conditional on usage keeping pace with unlocks.
Risk Matrix (Know What Can Break the Thesis)
| Risk | How It Shows Up | Response |
|---|---|---|
| Macro shock | DXY ↑, real yields ↑, risk assets sell | Cut beta, rotate to BTC/ETH, reduce perps |
| Policy surprise | Listings halted, liquidity fragments | Increase cash, favor compliant venues |
| Funding froth | Funding >> 0.05%/8h; spot lags | De-risk longs, wait for spot catch-up |
| Unlock overhang | Persistent sell pressure on green days | Trim into strength; wait for acceptance above VAH |
Playbook: Entries, Adds, and Exits
- Map structure before price: Draw your range (value area) on 4H/1D; add anchored VWAP from the most recent regime shift. Good trades usually start on acceptance above VAH with spot volume.
- Pyramid on retests, not on wicks: Add when price retests and holds the breakout shelf. Avoid adding into vertical candles (low RR).
- Use FDV guardrails: Convert your target into FDV and ask: does usage/liquidity justify that tier? If not, take partials and wait.
- Exit rules: Two daily closes back inside the prior value area = thesis off. Don’t negotiate with structure.
FAQs (Short, Useful, Non-Fluffy)
Q: Are these targets valid if BTC stalls under $70k?
We trim the high end of all bands ~20% and favor ETH/L1 quality + fee-proven DeFi. AI/RWA become more selective.
Q: What would convince you to lift targets mid-year?
Stablecoin float expanding >10% Q/Q, ETH/BTC trending up for 4–6 weeks, and spot-led breadth across L2/DeFi/AI simultaneously.
Q: Should I chase memecoins instead?
That’s a different game with different risk math. This framework is for assets with discernible usage/fees/liquidity. If you must, cap risk tightly and treat as event-driven trades.
Appendix — How to Adjust These Numbers Yourself
- Pick your BTC path: range / advance / euphoria. Multiply the upper band by 0.8 / 1.0 / 1.2 respectively.
- Check ETH/BTC. If trending down, haircut alt targets by 15–25% depending on severity.
- Look at stablecoin supply. If flat to down, trim another 10% off high bands for DeFi and L2s.
- Assess usage (fees/TVL/DAU). If the 90-day trend is rising, hold the band; if not, move to the lower half.
- Microstructure sanity check: if funding is hot and spot thin, delay adds; if spot leads and books thicken, you can lean in.
Disclaimer: This article is educational analysis, not investment advice. Numbers are scenario ranges based on stated assumptions. Cryptoassets are volatile and can result in loss of principal. Do your own research, verify data from official sources, and use prudent risk controls.