
Altcoin Market Cycles: What History Says—and How to Trade the Next One
Altcoin cycles are not random manias. They tend to follow a recognizable sequence of liquidity rotation, policy and macro inflections, and reflexive feedback from narratives and on-chain incentives. If you map the last two full expansions—2017–18 and 2020–21—using concrete, falsifiable numbers, you’ll see similar contours: Bitcoin breaks higher → dominance falls → ETH outruns BTC → Layer-1/Layer-2 rotations → DeFi/NFT/memecoin blow-off → broad mean reversion. This article rebuilds that picture with data, highlights the signals that mattered, and proposes base/bull/bear scenarios for the next 12–18 months.
TL;DR
• Cycles rhyme: In 2017–18, alt mcap (TOTAL2) expanded from roughly the low tens of billions to ~$500–600B at the January 2018 peak; Bitcoin dominance (BTC.D) fell from ~85% to ~35–40%. In 2021, TOTAL2 ultimately crested near ~$1.5–1.8T as BTC.D slid from ~70% to the low 40%s before chopping.
• Rotation order matters: BTC leads breakouts; ETH/BTC trend turns; capital fans out to high-beta L1s/L2s; then to mid/micro caps, DeFi, NFTs, and meme-coins. The later the rotation, the lower the average quality and the sharper the drawdowns.
• Watch five dials: TOTAL2 vs its 20-week EMA, BTC.D trend, ETH/BTC weekly structure, net stablecoin issuance, and perp funding + OI concentrations. Together they framed both prior alt seasons.
• 2025 base case: An altcoin expansion led by ETH + L2 throughput and real-yield DeFi returns, targeting a retest of $1.2–$1.6T TOTAL2 over 12–18 months if BTC consolidates structurally. Bull case stretches to $2.0–$2.5T; bear case stalls beneath $1T.
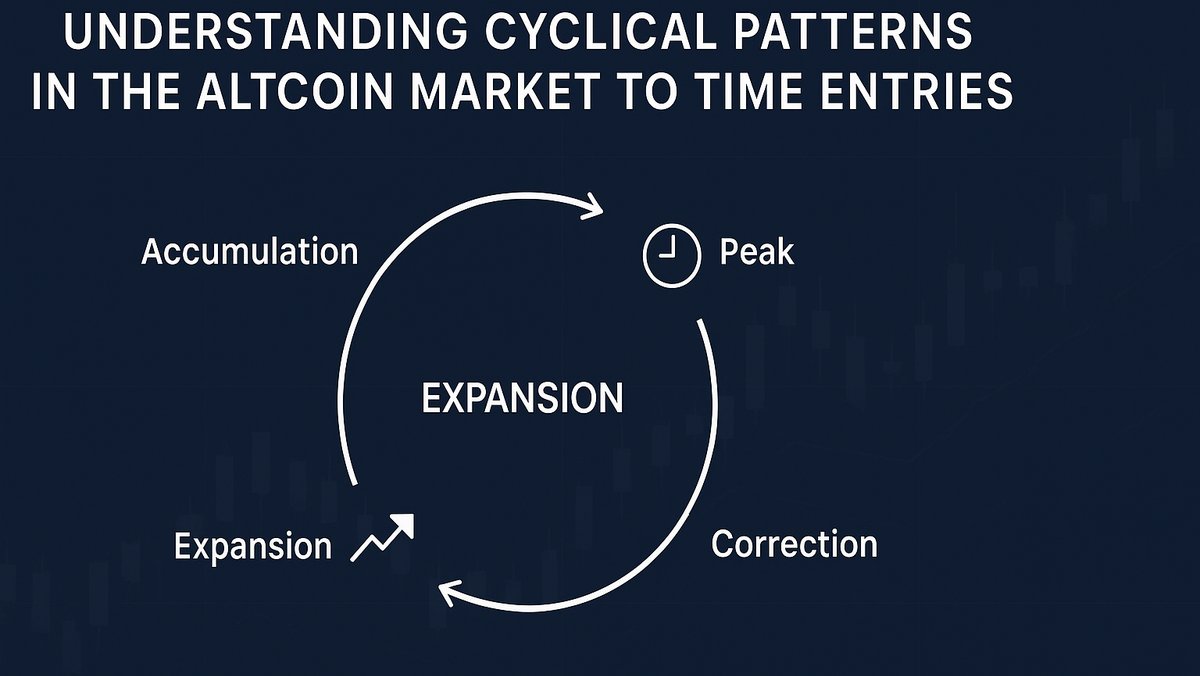
What Is an Altcoin Cycle?
An altcoin cycle is the multi-month period when aggregate non-BTC market capitalization (often proxied by TOTAL2) trends up faster than BTC, and breadth improves across non-BTC assets. The catalyst is typically liquidity expansion (new fiat/stablecoin inflows, leverage availability) plus a narrative unlock (e.g., smart contracts in 2017, DeFi + NFTs in 2021, and potentially L2/app-chain throughput and RWAs next).
Sequence (stylized): BTC rallies from a higher timeframe base → BTC volatility compresses and the rally pauses → ETH/BTC breaks higher → capital rotates to L1/L2s (Solana, Avalanche, BSC, Base/Arbitrum/Optimism, etc.) → DeFi/NFTs/memecoins go parabolic → exit liquidity concentrates in the smallest caps → regime flips as funding overheats and stablecoin growth stalls.
Cycle 1: 2017–2018 by the Numbers
| Metric | Start (early 2017) | Peak (Jan 2018) | Change | Notes |
|---|---|---|---|---|
| Altcoin Market Cap (TOTAL2) | ~$15–25B | ~$500–600B | ~20–30× | Explosive listing cycle; ICO boom |
| Bitcoin Dominance (BTC.D) | ~85% | ~35–40% | −45–50 pts | Capital rotated to ETH + ICOs |
| ETH price | ~$8–10 | ~$1,400 | ~140× | ETH became de facto ICO collateral |
Character: The core driver was primary issuance (ICOs) and virgin narratives (smart contracts) meeting unprepared liquidity. Drawdowns post-peak were brutal (−70% to −95% across alts) as regulation tightened and USD inflows reversed.
Cycle 2: 2020–2021 by the Numbers
| Metric | Start (mid-2020) | First Peak (May 2021) | Second Peak (late 2021) | Notes |
|---|---|---|---|---|
| Altcoin Market Cap (TOTAL2) | ~$70–90B | ~$1.3–1.5T | ~$1.5–1.8T | Two-stage: DeFi Summer → L1/NFT mania |
| Bitcoin Dominance (BTC.D) | ~70% | ~40–45% | ~40–45% | Dominance fell, then chopped in a range |
| ETH price | ~$200–250 | ~$4,000 | ~$4,800 | ETH/BTC trended up into spring, paused, then re-accelerated |
Character: This cycle featured cash-flow narratives (DEX fees, lending revenue), on-chain consumer apps (NFTs), and fast L1s (SOL/AVAX/BSC) alongside L2 groundwork. Stablecoin supply surged, credit conditions eased, and maker/arbitrage infrastructure matured—tightening pegs and deepening liquidity compared to 2017.
What Actually Marks the Start of Altseason?
There is no gong. But three conditions tended to cluster near the inflection:
- BTC pauses up (not down): A constructive consolidation after an impulsive BTC leg higher. Sideways-to-slightly-down BTC with declining realized volatility has historically been friendly for alts.
- ETH/BTC weekly uptrend: A higher high + higher low structure, often coinciding with technical breaks through long-term moving averages or trendlines.
- Stablecoin net issuance turns positive: New dollars on-chain (not merely rotation) fund breadth. Falling issuance starves the tail.
Five Indicators That Mattered in 2017 & 2021
| Indicator | What to Watch | Why It Works | Historical Behavior |
|---|---|---|---|
| TOTAL2 (ex-BTC mcap) | Weekly close vs. 20W EMA; range breakouts | Captures breadth; 20W EMA often the bull/bear demarcation | 2017 & 2021 rallies sustained while above 20W EMA |
| BTC Dominance (BTC.D) | Trend direction, not absolute level | Downtrend = rotation to alts; uptrend = defensive BTC bid | Steep downtrends aligned with alt blow-offs |
| ETH/BTC | Weekly market structure + 200D/20W overlays | ETH leadership precedes L1/L2 rotations | Breakouts in Q2–Q3 2017 and Q1 2021 predated alt breadth |
| Stablecoin Net Issuance | 30–90d change for USDT/USDC/DAI/FRAX | Funds marginal demand and liquidity provisioning | Positive slope supported both cycles’ mid-legs |
| Perp Funding & OI | Persistent + funding; OI as % of mcap | Identifies overheated leverage & liquidation risk | Late-stage 2021 showed regime of +funding & high OI |
The Rotation Ladder (and Why Late Rungs Break)
- BTC impulse breaks macro levels → confidence returns.
- ETH leadership (ETH/BTC up) → general risk appetite improves.
- High-beta L1/L2s catch flows (SOL, AVAX, ADA; Arbitrum, Optimism, Base, etc.).
- DeFi/NFT infrastructure rerates as volumes/fees rise.
- Memecoins & micro caps explode on retail reflexivity.
The error most newcomers make is allocating heavily at rung 5. By then, stablecoin growth often plateaus, funding stays positive for weeks, and breadth participation masks poor liquidity depth. A single market-wide deleveraging event can erase months of gains in the tail.
Why 2021 Wasn’t 2017 (and Why the Next Won’t Be 2021)
• Market plumbing matured: Deeper CEX/DEX books, faster arbitrage, and robust perps smoothed many depegs and tightened spreads in 2021 vs 2017. Expect the next cycle to be even more efficient—good for execution, but it reduces the duration of mispricings.
• On-chain cash flows mattered: In 2017, token value props were mostly promises. In 2021, AMM/Lending/Bridge/NFT fees created genuine LTV anchors (even if reflexively inflated). The next cycle will likely emphasize real yield (stake-based or fee-distribution) and L2 throughput.
• Regulatory perimeter widened: Policy clarity changed winners and distribution. The next cycle’s leadership may skew toward assets that fit within compliant rails (stable, L2s, RWAs) and away from hard-to-list geographies.
What Could Lead in 2025–2026?
Three credible leadership tracks:
- ETH + L2 Throughput: If ETH/BTC regains trend and L2 TPS/fees keep improving, capital may favor execution layers (Arbitrum/Optimism/Base/zkSync/Starknet), rollup-native apps (perps, payments), and MEV-capturing protocols.
- High-Performance L1s: A renewed performance bid (Solana et al.) when consumer apps (gaming, social, micro-payments) hit mainstream latency/UX expectations.
- Real-World Assets (RWA) & On-Chain Treasuries: Tokenized T-bills and revenue-sharing DeFi flywheels can become the defensive yield leg that keeps capital on-chain between risk spikes.
Scenarios for TOTAL2 (Non-BTC Market Cap)
| Scenario (12–18m) | Drivers | Indicative TOTAL2 Range | Playbook |
|---|---|---|---|
| Base | BTC consolidates; ETH/BTC uptrend resumes; stablecoin growth moderate | $1.2–$1.6T | Barbell ETH/L2 + selective L1s; rotate into DeFi cash-flow when volumes rise |
| Bull | Macro tailwinds; strong net issuance; app breakout (gaming/social/RWA) | $2.0–$2.5T | Scale winners; add beta via leaders’ ecosystems; shorten holding periods late |
| Bear | Regulatory shock; risk-off macro; stablecoin contraction | $0.7–$0.9T | Defense: overweight BTC/stables; farm real yield; only buy capitulation wicks |
Ranges are illustrative; always cross-check with your data source before acting.
A Simple, Rules-Based Alt Season Playbook
1. Market Regime Filter: Only deploy alt risk if TOTAL2 weekly is above its 20-week EMA and ETH/BTC is in a weekly uptrend. Otherwise, keep sizing small and focus on relative strength.
2. Rotation Rules: Start with ETH and one or two high-liquidity L1/L2s showing trend strength. Only add tail exposure after a week of improving breadth (advance/decline, number of coins above 50D MA) and positive net stablecoin issuance.
3. Funding/OI Risk Brakes: If average perp funding across your watchlist stays > +0.05%/8h for a week and OI/FDV balloons, cut leverage or rotate to quality. Late-cycle tails are where most PnL is given back.
4. Exit Discipline: Trail winners with weekly swing lows. If BTC breaks down while alts remain elevated, assume reflexive downside and take gross exposure down pre-emptively.
Red Flags That Ended Prior Alt Seasons
- BTC Down + Dominance Up: A sour combo. Capital flees to BTC and stables; tails air-pocket.
- Stablecoin Stagnation: When net issuance flattens or reverses, rallies become distribution.
- Perp Basis Blow-Off: Extended positive funding + max OI concentration on the same leaders often preceded liquidations in 2021.
- Policy Shocks: Adverse headlines around listings, enforcement, or banking rails accelerated regime flips in both cycles.
Case Study 1: Spring 2017 → Jan 2018
BTC rallied from sub-$1k to near $20k; ETH/BTC trended up across 2017; ICOs vacuumed ETH supply. TOTAL2 broke its prior range in mid-2017 and sailed above its 20W EMA until early 2018. The denouement came as policy/issuer risk rose and USD inflows slowed. Once BTC rolled over and dominance rebounded, alt breadth collapsed, and illiquid tails suffered −90% style drawdowns.
Case Study 2: DeFi Summer → 2021 Peak
Starting mid-2020, TVL and on-chain volumes lifted DeFi tokens with real fees. By Q1 2021, ETH/BTC leadership and rising stablecoin supply pushed breadth wider; fast L1s captured retail. The late phase mixed NFTs/memecoins with heavy leverage and high positive funding. The unwind featured a cascade of long liquidations and a multi-quarter distribution into lower highs.
Practical Data Dashboard (Build-Your-Own)
- Price/Breadth: TOTAL2 vs 20W EMA; % of top-200 alts above 50D MA.
- Rotation: ETH/BTC 1W trend; BTC.D 1W trend; leaders’ relative strength lines.
- Liquidity: Net stablecoin issuance (USDT/USDC/DAI/FRAX); DEX 7D volumes; CEX spot/perp ratios.
- Leverage: Funding rates (simple average and leaders), OI as % of float/FDV.
- On-Chain Activity: L2 TPS and gas, active addresses for leaders, fee revenue for DeFi primitives.
Position Sizing & Risk
Alt cycles deliver outlier upside but punish late/levered exposure. A robust template:
- Core/Satellite: 50–70% in leaders (ETH + 1–2 L1/L2s), 20–30% in mid-caps with catalysts, ≤10% in high-beta tail; only expand tail when the dashboard is firmly risk-on.
- Staged Entries: Build on constructive weekly closes; avoid chasing daily breakouts into elevated funding.
- Stop & Time-Based Exits: Weekly close below 20W EMA on TOTAL2 trims gross; a second weekly lower high reduces tail to zero.
- Event Hedging: Around macro/policy events, reduce leverage or pair longs with BTC/ETH shorts to keep net beta under control.
Frequently Asked Questions
Do alt cycles require BTC to make new highs? No. They require confidence (often delivered by BTC impulses) and space (a BTC volatility pause). Some of the best alt breadth occurred while BTC ranged after an up-leg.
Is BTC dominance a timing tool? It’s a context tool. Dominance pressure downwards supports alt breadth, but you still need ETH/BTC leadership and net stablecoin inflows for durability.
Should I rotate everything when ETH/BTC breaks out? Don’t “all-in rotate.” Scale. Let the market confirm with breadth and liquidity expansion. Keep a BTC/ETH core; use satellites for beta.
What about new narratives (AI, RWA, SocialFi)? Narratives choose the leaders within a cycle; they don’t replace the cycle mechanics. Treat new narratives as where to look once the cycle dials flip risk-on.
Key Takeaways
- 2017 and 2021 shared a familiar pathway: BTC impulse → ETH leadership → L1/L2 rotations → tail frenzy → sharp mean reversion.
- The five-dial dashboard (TOTAL2, BTC.D, ETH/BTC, stablecoin issuance, funding/OI) framed both expansions and their peaks.
- For the next 12–18 months, a base case extends TOTAL2 toward $1.2–1.6T if BTC ranges constructively and ETH/L2 throughput improves; bull stretches to $2.0–2.5T; bear caps below $1T.
- Alpha often comes from rotation timing and risk discipline more than from picking the perfect small-cap.
Methodological note: Because crypto data updates continuously and methodologies differ across providers, the numerical ranges here are deliberately rounded (e.g., “~$500–600B”). Always refresh exact values from your preferred datasets before sizing positions.
Disclaimer: This article is for educational purposes only and is not investment advice. Digital assets are volatile and can result in total loss. Do your own research and consider consulting a licensed professional before making investment decisions.


