
Editor’s note: This is independent analysis, not investment advice. Our goal is to help serious readers think in frameworks, not in headlines. All levels discussed are illustrative ranges, not trade recommendations.
Context: When “Up or Down, It’s Down”
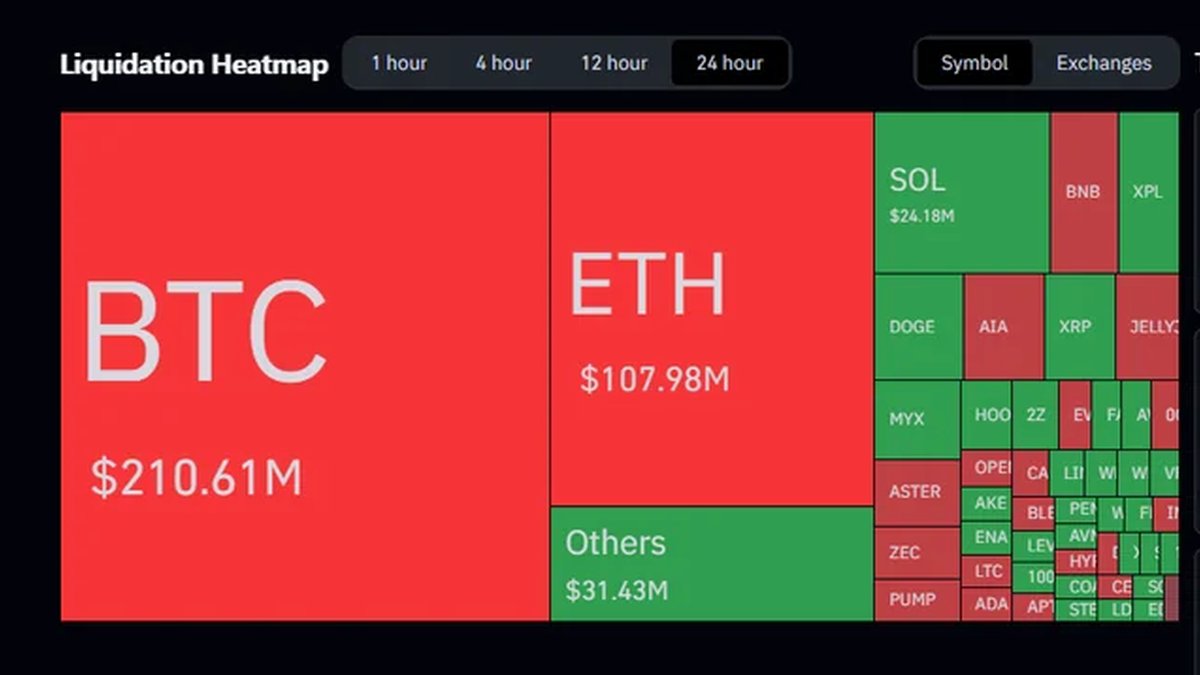
October served a humbling reminder that markets respond less to the headlines themselves and more to positioning, liquidity, and the path of expectations. In quick succession we saw a Federal Reserve rate cut that had been telegraphed for weeks, encouraging noises around U.S.–China trade talks, and a steady pipeline of institutional crypto developments. Yet Bitcoin slipped below the $107,000 area, while large-cap altcoins—ETH and SOL among them—fell 8–15%. Derivatives screens flashed red as a cascade of liquidations wiped out over $1B in notional futures in a single day. A viral poll on X suggested 80% of respondents planned to step away from the market, citing heavy-handed manipulation and a sense that price now fades both bad and good news.
That dissonance—strong macro optics alongside weak price—feels like gaslighting if you don’t have a map. Let’s build one.
Why Both Good and Bad News Sold Off
There are four overlapping explanations, each grounded in market microstructure rather than conspiracy.
1. Positioning was heavy before the news. By the time the Fed cut arrived, the cut was the baseline. When a widely expected dovish signal lands, the incremental buyer disappears unless there is a genuine upside surprise. In that vacuum, dealers and market makers reduce inventory, and systematic flows (from CTAs to options hedging) react to price—not to the press release. This is how you get “good news, bad price.”
2. Liquidity has become episodic and shallow. Crypto order books are deep around the mid, but the impact liquidity—what you can actually move without bending the tape—remains thin outside major venues and hours. In those conditions, a few large market orders can push price into areas of stacked stops, triggering cascades that look like “someone is in control” when it’s really the path dependency of modern matching engines doing their work.
3. Derivatives feedback loops dominate intraday direction. Elevated open interest plus aggressive long skew sets the stage for forced sellers. Once the first wave of long liquidations hits, funding resets, and volatility-targeted strategies de-risk, creating a self-fulfilling downdraft. The headline is the spark; the structure is the fuel.
4. Distribution into strength. In maturing cycles, sophisticated holders use rallies around predictable news windows to reduce risk. The pattern—rally into event, sell the event—feels like manipulation to those arriving late. It’s often just patient inventory management by players with longer horizons.
The Anatomy of October’s Shock
Reconstructing the month from footprints (price, liquidations, funding flips, and options skew) yields a familiar sequence:
• Pre-positioning: Spot climbed on anticipation of a policy tailwind. Perps premium over spot widened; call skew cheapened as traders chased upside convexity.
• Event window fade: The cut met expectations, not exceeded them. First leg lower targeted obvious intraday liquidity pools under recent swing lows, which sat near popular leverage entries. Passive bids were thin; market sell orders walked the book.
• Cascade: As stops triggered, margin thresholds were breached; auto-deleveraging and liquidation bots added inventory to an already stressed tape. Options dealers short gamma sold more as spot fell, pushing into lower strikes.
• Stabilization: After forced-selling abated, funding normalized toward flat, and skew moved from calls to puts—classic signs the clearing cycle had done most of its work. But confidence lags price; participation remained low.
Notice what’s not in this list: a grand mastermind. The pattern is what you’d expect in any market where derivatives penetration outpaces spot depth. Understanding that removes some of the emotional sting and replaces it with probabilities.
The 80% Poll: Capitulation or Mirage?
Sentiment polls are useful mostly at extremes. An informal vote showing 80% of retail-leaning traders stepping away reads like capitulation. Historically, the best risk-reward often emerges when retail conviction collapses while structural holders quietly accumulate. But this isn’t an iron law; it’s a setup that can turn into a bottom if other signals agree.
What would we want to see to upgrade a capitulation reading to a legitimate accumulation signal?
- Derivatives de-risked: Open interest off the highs; funding hovering around zero or mildly negative; options skew balanced or modestly put-leaning.
- On-chain outflows from exchanges: Net transfer of major coins from exchange hot wallets to cold storage consistent with medium-horizon holding behavior.
- Realized losses absorbed: On-chain realized loss spikes followed by stabilization indicate weak hands have sold and markets are digesting.
- Time, not just price, at support: Multiple sessions basing near a well-watched level are more constructive than a single dramatic wick.
If those conditions cluster, we treat the 80% “I’m out” as a contrarian tailwind. Without them, it’s just a mood.
Why ETH and SOL Fell Harder
Majors underperformed Bitcoin for reasons that should be familiar to anyone who has traded a few cycles:
- Beta and basis. In drawdowns, high-beta L1s and L2s move 1.5–2.5× BTC’s daily percentage change. Basis trades (spot vs. perps) unwind quickly, turning small spot sales into outsized tape impact.
- Liquidity fragmentation. Capital is spread across dozens of venues, bridges, and wrapped assets. In stress, that fragmentation means fewer natural buyers at each price step.
- Programmatic rotation. Quant frameworks that de-risk on volatility spikes systematically dump the highest beta first. If you felt like every bid vanished simultaneously on your SOL/ETH pairs, that’s why.
Is “Whale Accumulation” Real or Cope?
Every selloff produces posts about large wallets buying the dip. Some of those flows are real, and some are internal transfers (custody changes, venue shuffles) that don’t imply directional intent. The practical approach is to triangulate:
- Exchange balances: Sustained declines in exchange-held BTC/ETH paired with rising long-term holder supply is the robust form of accumulation.
- Age bands: If older coins remain dormant while young coins churn, long-term conviction remains intact.
- Stablecoin supply: Rising net stablecoin issuance and inflows to exchanges during selloffs often preface durable buying.
We’re not in the business of wishful thinking; we track the trifecta above. If all three align, the whale narrative has teeth. If not, assume stories are just stories.
What “Manipulation” Usually Means
Retail discourse uses “manipulation” to describe outcomes that feel unfair. Professionals use a colder taxonomy:
- Liquidity harvesting: Traders target zones where stop orders cluster. This is not illegal; it’s rational behavior in an open order book.
- Dealer hedging: Options desks delta-hedge dynamically. In one-sided flows, their hedging can appear like “someone pushing the market.” It’s automated supply and demand.
- Information asymmetry: Some participants react faster to hidden or emerging information (flows, venue outages, liquidations). Speed is an edge; crying foul won’t make it go away.
Knowing these mechanics won’t make drawdowns pleasant, but it will keep you from hunting ghosts.
A Professional Playbook for the Next 2–6 Weeks
1) Define your lane
- Investor (months/years): Decide your long-term allocation to crypto risk. If price is within your strategic range, scale in on time, not emotions. Use calendar ladders (e.g., weekly tranches) and automate.
- Swing trader (days/weeks): Focus on levels where liquidity is likely to be thick: prior weekly closes, recent liquidation clusters, and option strike magnets. Trade both sides; dogma kills.
- Intraday: If you don’t have low-latency tools and risk discipline, sit out chop days. Your job is to survive to trade trend days.
2) Reduce the path dependency
- Use stop brackets and OCO orders. If a move is wrong, make it small. If it’s right, let it breathe.
- Position sizing: For swings, size so that a typical adverse excursion (1.5–2.0× recent ATR) doesn’t blow your day.
- Hedge the book: Short dated, out-of-the-money puts in majors are expensive after a shock. Before the next one, they’re cheap protection. Buy umbrellas when the sun is out.
3) Watch the right dashboards
- Funding & OI: A flat-to-negative funding reset with OI lower by 10–20% from peaks is constructive.
- Options skew: Puts bid and implied vol elevated? Expect mean-reverting rallies. Calls bid and skew complacent? Beware squeezes the other way.
- On-chain exchange flows: Net outflows after a selloff — especially into long-term holder wallets — add credibility to dip-buying claims.
A Simple Framework for Scenario Planning
| Scenario (2–6 weeks) | What You’d See | Implications | Risks |
|---|---|---|---|
| Bear: Distribution continues | Lower highs on bounces; funding drifts positive quickly; options call skew returns; alt underperformance persists | Fade rips into resistance; reduce beta exposure; avoid illiquid small caps | Hotter-than-expected macro prints; new regulatory overhang; venue stress |
| Base: Range and rebuild | Multiple sessions holding near support; OI down; funding flat; on-chain shows slow exchange outflows | Mean-reversion trades; accumulate quality on red days; sell covered calls against inventory | Headline shock revives liquidation spiral; patience tested |
| Bull: V-shape in majors | Sharp reclaim of breakdown levels; skew normalizes; breadth improves; perps discount vs. spot closes | Chase with discipline only after higher low confirms; prioritize high-liquidity leaders | False breakouts common; late longs vulnerable to fast reversals |
For Altcoin Holders: A Tough-Love Checklist
- Time horizon reality check. If your holding period is days but the project’s catalysts are quarters, you are not investing; you are donating to the churn.
- Liquidity rules. Minimum daily dollar volume should be a hard filter, not a vibe. Illiquid names amplify slippage in both directions.
- Correlation trap. In drawdowns, idiosyncratic stories correlate to BTC/ETH. Don’t kid yourself that a clever narrative will decouple your bag.
- Staking and lockups. Rewards are not a free lunch. Understand unlock schedules, validator commissions, and the risk of being forced to unstake into weakness.
Macro: Rate Cuts, QT, and Why Liquidity Is Not a Switch
Yes, lower policy rates are ultimately supportive for risk assets, all else equal. But the route from central bank decisions to crypto net liquidity is indirect. It flows through bank reserves, money market fund behavior, Treasury issuance, and risk appetite in traditional credit. Meanwhile, positioning around well-telegraphed cuts often front-runs the event. The result is a paradox: the first cut can be sold because the path matters more than the point. Crypto, a high-volatility asset class tethered to global dollar liquidity, will continue to exhibit this sensitivity. Treat cuts as a chapter, not a punchline.
Psychology: The Discipline of Doing Less
One root cause of losses in months like October is overtrading. The remedy is mechanical:
- Pre-commit to trade frequency. A daily cap on the number of discretionary trades forces prioritization.
- Pre-commit to a boredom plan. If there’s no high-conviction setup, you default to research, not to another round-trip.
- Journal in numbers. Track expectancy by setup. Kill the ones with negative EV even if they’re fun.
When 80% of a poll says they’re leaving, the edge shifts to those who can stay present without forcing trades. Professionals survive by trading their plan, not their mood.
What Would Negate the Bearish Tape?
We look for a cluster of evidence, not one magic candle:
- Strong reclaim of breakdown levels followed by a higher low on retest.
- Funding and OI behavior that suggests fresh longs are not overleveraged (flat funding, OI biased to options rather than perps).
- Breadth improvement where ETH and SOL outperform on green days and underperform less on red ones; small caps lag (quality-first rotation).
- On-chain validation via persistent exchange outflows and rising long-term holder balances.
Risk Factors That Don’t Fit in a Chart
- Venue and counterparty risk. Withdrawal delays, API outages, or settlement quirks can turn good trades into bad experiences. Diversify venue exposure and test withdrawals before you need them.
- Stablecoin plumbing. A hiccup in a major stablecoin’s banking or chain integrations can create transitory dislocations; keep dry powder in multiple rails.
- Regulatory cadence. Enforcement headlines arrive on their own schedule and care little for your technical levels. Position sizing is your seatbelt.
Putting It All Together
October’s message is not that the market is rigged; it’s that the structure often overpowers the story, especially when positioning is crowded. A rate cut that fails to beat expectations is not bullish on the day it lands. Well-telegraphed trade détente headlines will not lift a tape already leaning long if liquidity is thin and stops are clustered. And a poll showing 80% of traders leaving can be a contrary tell—or just a cathartic vent—depending on whether the hard data (derivatives, on-chain flows, breadth) says the clearing process is advanced.
For disciplined participants, this is a workable environment. Investors with multi-year horizons should welcome a reset that bleeds leverage and hands them better entry points. Swing traders should anchor to levels, not to news, and respect the mechanics that convert small catalysts into large moves. Intraday players should either arm themselves with the right tools or step aside on days when algorithms are in control.
Most of all, replace the word “manipulation” with a checklist. If you can explain a move with positioning, liquidity, and hedging flows, you don’t need a villain. If you can’t explain it, your size is too large for your uncertainty, and that’s on you—something you can fix today.
Bottom Line
The claim that “the market falls on good news and bad news alike” is not a paradox; it’s a sign of a regime where expectations are tight, liquidity is episodic, and derivatives drive the path. The crowd’s decision to step away may mark the emotional low if and when structural signals confirm. Until then, the highest-signal behaviors are simple: protect your downside, let the tape rebuild trust, and act only when the market pays you to take risk—on your timeframe, with your rules.
© 2025 Global Markets Desk. Reproduction allowed with attribution. This analysis is educational and should not be construed as investment advice.


