Nearly 7 Million Bitcoin Are Underwater: Capitulation, or the Start of a Stronger Market?
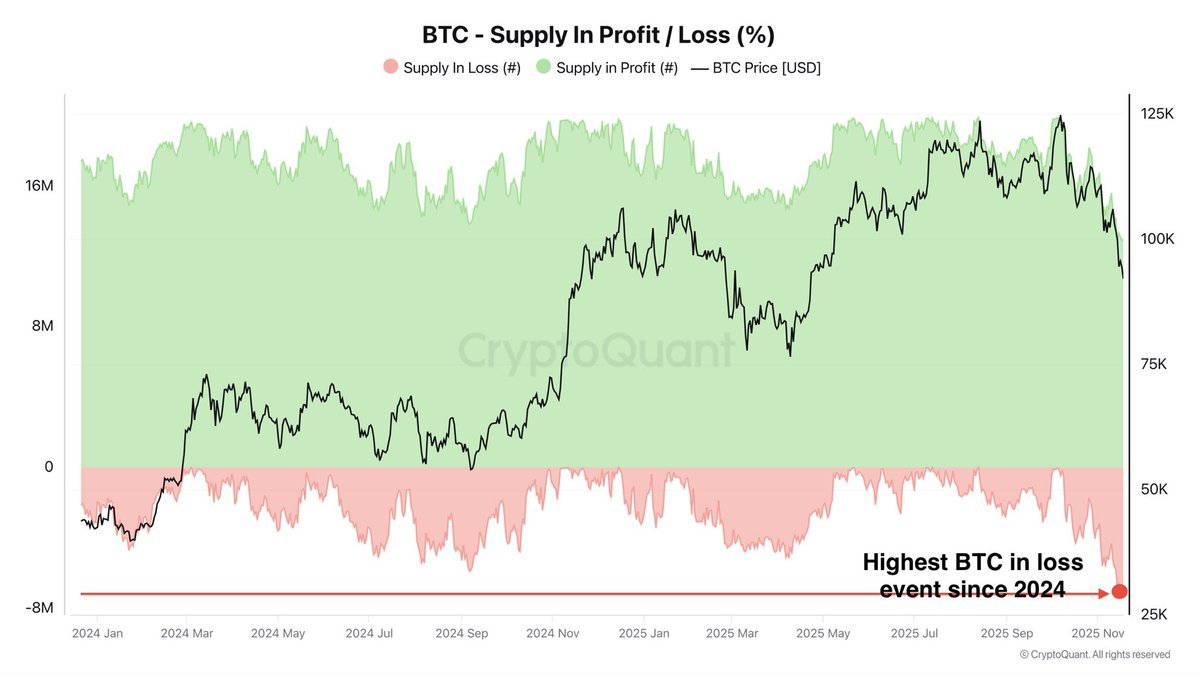
The latest on-chain data paints a harsh picture: roughly seven million BTC are now sitting in unrealised loss. In other words, a huge cohort of investors bought their coins at prices higher than today and are, on paper, in the red. According to the CryptoQuant chart you shared, this is the largest amount of Bitcoin in loss since the beginning of 2024.
At first glance, this sounds like a disaster. It is certainly painful for anyone who chased prices near the highs above 120,000 USD and now finds themselves down tens of percent. But if we zoom out and study how similar situations unfolded in past cycles, the picture becomes more nuanced. Periods when a large share of supply is underwater have historically coincided with something else: a transfer of coins from short-term, emotionally driven holders to long-term, price-insensitive ones.
That transfer doesn’t happen politely. It is forged in panic, impatience and exhaustion. Yet it is precisely this churning of ownership that often turns speculative blow-offs into more stable foundations for the next advance.
1. What the chart is really showing
The CryptoQuant chart tracks two key metrics over time:
- Supply in profit – the amount of BTC whose current price is higher than the price at which it last moved on-chain.
- Supply in loss – the amount of BTC whose last on-chain move was at a higher price than today, meaning the holder is sitting on an unrealised loss.
These are plotted as overlapping green (profit) and red (loss) regions, with the Bitcoin spot price shown as a black line. When price is near or above all-time highs, almost all coins are in profit; the red area shrinks. When price falls sharply from those highs, the red region expands as more and more coins slip below their cost basis.
Today, that red zone has swollen to levels not seen since the washouts of 2024. That implies several things at once:
- A very large number of coins changed hands near the top of the market, especially during the euphoria around six-figure prices and ETF inflows.
- A meaningful share of that new cohort of buyers lacks deep conviction; many are now positioned at uncomfortable levels of drawdown.
- From a market-structure perspective, there is a large reservoir of potential selling pressure if those underwater holders capitulate.
But the same chart also tells us something subtler: every time supply in loss spikes to extremes, some investor on the other side of those trades is buying the panic.
2. Who is underwater? Short-term vs. long-term holders
On-chain analysts often split the market into short-term holders (STHs) and long-term holders (LTHs). While the exact thresholds vary by provider, the basic idea is simple: coins that have moved within roughly the last five months are attributed to short-term holders, while older coins are classified as long-term.
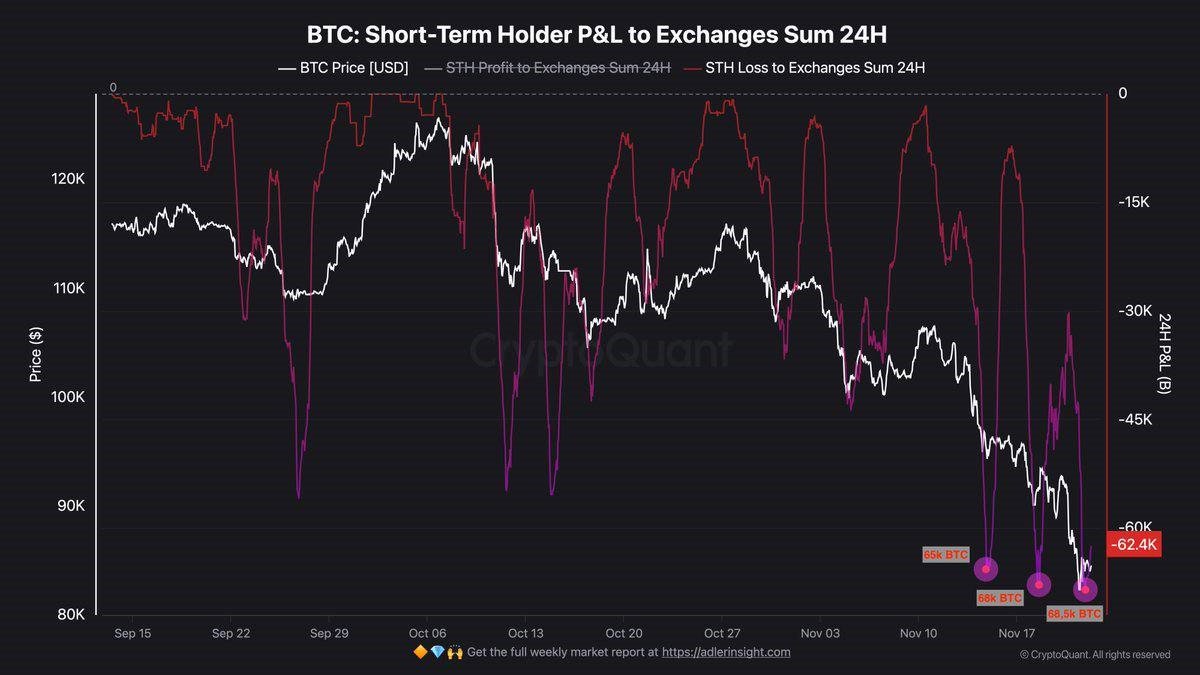
The current spike in supply in loss is largely driven by STHs – investors who entered the market late in the trend, buying when Bitcoin had already rallied deep into six figures. Many of them came via spot ETFs or newly opened exchange accounts. They did not accumulate through prior bear markets; they arrived when the story was already on the front page.
By contrast, long-term holders typically built positions at much lower prices. Even after the recent drawdown, a large share of LTHs remain in profit. Their cost basis might be 25,000, 40,000 or 60,000 USD, depending on when they accumulated. When price drops from 120,000 to below 90,000, they feel less pressure to act. In some cases, they even add to their positions, effectively buying coins that capitulating STHs are dumping.
This asymmetry is crucial. The seven million coins in loss are not evenly distributed across all holders. They are concentrated in those who are least emotionally prepared and least structurally committed to hold through deep volatility. That is exactly the group most likely to provide liquidity to stronger hands.
3. How we got here: FOMO, leverage and the ETF era
The current underwater cohort is the product of three overlapping drivers:
3.1. FOMO at the highs
As Bitcoin pushed above 100,000 USD and into the 120,000+ range, a familiar feedback loop took hold. Media coverage framed BTC as the must-own trade of the year. Social networks were filled with screenshots of paper gains. Newcomers extrapolated recent performance into the future and assumed that any dip would be shallow and short-lived.
Many of these buyers entered positions with little margin for error. Purchasing at or near the all-time high means even a healthy 25–30% correction – a routine event in Bitcoin’s history – pushes you deep into loss.
3.2. The comfort of ETFs
The rise of spot Bitcoin ETFs has been transformative. It has opened the market to investors who would never self-custody, trade on offshore exchanges or hold unregulated products. But it has also changed the psychology of entry.
Buying a ETF in a brokerage account feels familiar and low-friction. The same investor who would think twice before wiring funds to a crypto exchange might happily add “a little BTC exposure” next to their equity index funds. When price ran hard, ETF flows chased that strength. The result: a large slug of coins with a cost basis clustered around the top of the range.
3.3. Leverage and overconfidence
Finally, leverage – both visible in derivatives and hidden in off-exchange borrowing – amplified the move. As price rose, some investors used their appreciated positions as collateral for more exposure, assuming that the combination of ETF demand and halving narratives would provide a floor. When that assumption broke, forced liquidations pushed more coins into the red.
Put together, these dynamics created the conditions for what we see today: a market where a large block of supply is held by participants whose entries were not anchored in long-term strategy but in momentum and narrative.
4. Why a spike in “supply in loss” can be a constructive signal
It is tempting to interpret seven million BTC in loss as purely negative. After all, a market full of underwater holders could, in theory, dump at any moment, driving price down further.
History suggests a more complex relationship. In prior cycles, extreme readings in supply in loss – especially when they appeared after a long advance rather than during a grinding bear – often coincided with moments of capitulation and transfer rather than with the beginning of systemic collapse.
Here is why such spikes can be constructive:
• They shake out weak hands. Investors who bought for the wrong reasons – social proof, short-term greed, blind faith in a meme – are unlikely to hold through deep drawdowns. Capitulation events flush this cohort out of the ownership structure.
• They create opportunities for high-conviction buyers. Long-term investors who have been waiting for better entry points can accumulate from forced sellers at a discount to prior highs, improving the overall quality of the holder base.
• They reset expectations. After a painful period, narratives become more realistic. Talk of straight-line moves to 250,000 USD gives way to more measured discussions about cycles, macro conditions and risk management.
None of this guarantees that the current spike in loss is the bottom. On-chain metrics are guides, not oracles. But they do help us see that behind every red bar on a chart is a change in who owns the asset – and that change often sets the stage for the next phase.
5. The behavioural layer: fear, regret and time horizons
The psychological impact of being underwater is not linear. Losing 5% on a position feels annoying; losing 40% feels existential. The larger the floating loss, the more tempting it becomes to “make it back somewhere else” by selling at exactly the moment the long-term odds may be turning in your favour.
Behavioural finance research highlights several biases that become acute in environments like this:
- Loss aversion. People feel the pain of losses roughly twice as intensely as the pleasure of equivalent gains. That makes them more likely to capitulate at lows than to take profits at highs.
- Anchoring. Many investors mentally anchor to their entry price. If they bought at 115,000 USD, every tick below that level feels like an injustice to be corrected, rather than a normal fluctuation in a volatile asset.
- Recency bias. After a sharp selloff, recent price action looms large. It becomes easy to forget that previous cycles saw similar or deeper corrections before ultimately making new highs.
Long-term holders tend to manage these biases differently. They frame Bitcoin in multi-year or multi-cycle terms, treating volatility as noise rather than as a referendum on their thesis. When seven million coins are in loss, it is often these investors who are quietly providing the bids that stabilise the market.
6. Scenarios from here: not predictions, but frameworks
Instead of guessing exact price targets, it is more useful to outline plausible paths and the clues that might support each. The current supply-in-loss configuration is compatible with at least three broad scenarios.
6.1. Scenario A – Classic late-stage capitulation
In this path, the current drawdown and spike in loss mark the late stages of a bull-market correction rather than the start of a multi-year bear. A final wave of forced selling – possibly triggered by macro news or a high-profile liquidation – flushes out the weakest hands. On-chain metrics show a surge in volume at a loss, followed by a stabilisation of long-term holder balances.
Price might still make new local lows, but each dip is met by more aggressive accumulation from entities with larger balance sheets and longer time horizons. Over time, volatility compresses and BTC carves out a base before attempting another move toward and beyond the old highs.
6.2. Scenario B – A deeper regime shift
Here, seven million coins in loss is a warning sign rather than a bottoming pattern. Macro conditions deteriorate – for example, higher-for-longer interest rates, a sharp slowdown in ETF inflows, or regulatory setbacks. Under those pressures, even some long-term holders decide to de-risk, selling into any bounce.
The result is a more prolonged downtrend, with rallies consistently capped by overhead supply from underwater holders seeking to exit at breakeven. On-chain, supply in loss remains elevated for much longer, and metrics like long-term holder SOPR struggle to recover.
Even in this scenario, however, coins still migrate to new owners. The difference is simply that the process takes longer and inflicts more pain before a durable bottom is found.
6.3. Scenario C – A wide, frustrating range
In the third path, Bitcoin spends much of the next year chopping between two broad zones – say, the mid-70,000s on the downside and the low-100,000s on the upside. The seven-million-coin loss pocket gradually shrinks not through dramatic capitulation, but via slow distribution and re-accumulation across a wide price band.
This is, in some ways, the hardest environment to trade. Trend followers get whipsawed; long-term investors get bored. Yet from a structural perspective, a prolonged range can be healthy: it allows the market to digest prior gains, align expectations with fundamentals and build a more resilient holding base without the trauma of another 70% crash.
7. How to read this metric as a professional
For a professional outlet or investor, the key is not to fetishise any single on-chain line, but to treat it as one layer in a stack of evidence. Supply in loss is powerful because it connects price action to realised behaviour – actual coins moved on-chain at specific prices – rather than to narratives alone.
In practice, that means:
- Comparing current loss spikes to prior episodes, not just in magnitude but in duration.
- Overlaying loss data with metrics that track holder conviction, such as the age distribution of coins being spent and the balance changes of large, long-dormant wallets.
- Monitoring whether underwater supply is being realised at a loss (capitulation) or merely sitting – a crucial distinction between potential and actual sell pressure.
If seven million BTC in loss begins to fall while price stabilises or rises, that’s a sign that supply has successfully moved to stronger hands. If, instead, loss remains high and is repeatedly realised on every small bounce, the market may still be in the early or middle stages of its cleansing phase.
Conclusion: Pain today, potential energy tomorrow
There is no way to sugar-coat it for late entrants: buying Bitcoin near the highs and watching it slide tens of thousands of dollars lower is brutal. The on-chain reality of around seven million coins in loss is a snapshot of that collective pain.
Yet it is also a snapshot of something else: a market in transition. Coins purchased with short-term expectations are being re-priced, re-evaluated and, in many cases, re-allocated. Some holders will sell into despair and leave the space; others will treat the drawdown as a tuition fee and refine their approach. On the other side of every forced sale is someone for whom the same coin, at the same price, represents opportunity rather than regret.
Whether this episode marks the final flush before a renewed advance or just one waypoint in a longer, rougher journey will only be clear in hindsight. But one lesson from prior cycles holds: moments when the majority feels trapped are rarely the moments when structural risk is highest. More often, they are when the ownership base quietly improves, setting the stage for whatever comes next.
This article is for informational and educational purposes only and does not constitute investment, trading, legal or tax advice. Digital assets are highly volatile and may be unsuitable for many investors. Always conduct your own research and consider consulting a qualified professional before making financial decisions.