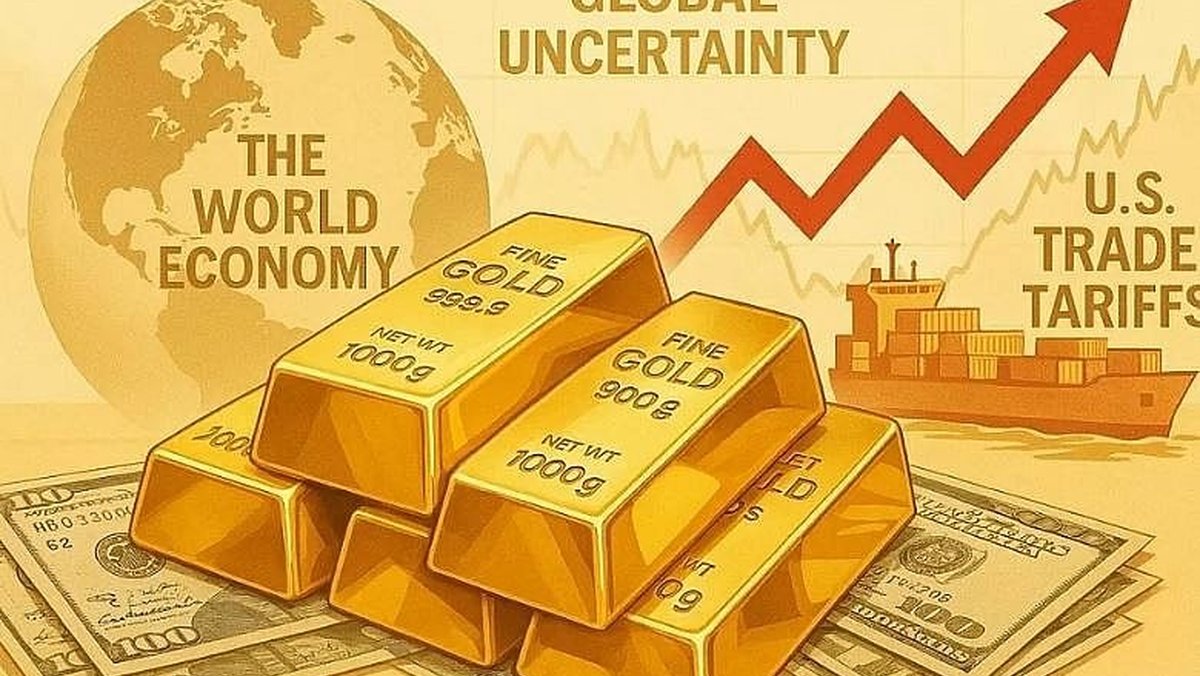
After a year of relentless gains that pushed spot gold above $4,000/oz, the market is split: do we extend toward the $5,000 calls for 2026, or is a consolidation overdue? This essay weighs macro liquidity, real rates, central-bank flows, valuation anchors (AISC multiples, Dow/Gold), and positioning to map both paths
Few assets divide a room like gold after a vertical rally. Following a year-long breakout that carried spot above $4,000/oz, the debate has turned tribal. One camp argues that the same forces that propelled the move—negative real-yield expectations, sovereign hedging, geopolitical instability, and soft-landing skepticism—are still in place and may even be accelerating. The other camp points to classic late-cycle tells: exuberant price targets (the $5,000-by-2026 calls), stretched valuation versus production costs, and inter-market signals (equities vs. gold) that warn of overheating. So which story deserves your capital next?
How We Got Here: The Four Engines of the Rally
1. Real rates and liquidity expectations. Gold is a long-duration, non-yielding asset. When investors expect real policy rates to grind lower—either through disinflation, future easing, or renewed balance-sheet expansion—gold’s opportunity cost shrinks. Even when headline rates are high, expectations about the path of real yields can pull demand forward.
2. Central-bank diversification. A growing list of monetary authorities has been adding bullion to reduce single-currency exposure. Whether you call it “de-risking” or “de-dollar drift,” the flow is uncorrelated with retail sentiment and tends to be sticky. It dampens drawdowns and turns dips into procurement windows.
3. Geopolitics and risk-parity hedging. Wars, election cycles, sanctions regimes, and shipping disruptions provide a structural bid for insurances that clear without counterparty risk. In a world of contested sea lanes and fragmented capital markets, a collateral asset that sits outside the financial system compounds in strategic value.
4. ETF/derivatives plumbing. Fresh inflows into gold-backed funds and a persistent preference for call spreads over puts turned flows pro-cyclical. Dealers hedged by buying spot/futures into strength; backwardation episodes signaled tightness and accelerated the move.
Valuation Anchors: Why “Expensive” Is Not the Same as “Finished”
Critics highlight two popular anchors. First, the market is said to be trading at roughly 2.6× all-in sustaining cost (AISC) for miners—above long-run averages. Second, the Dow/Gold ratio ≈ 10× implies investors are paying a historically rich multiple for bullion relative to U.S. equities. Both observations matter; neither is dispositive.
• AISC multiples cut both ways. When prices run ahead of costs, margins for miners expand, inviting supply responses—brownfield expansions, higher grades, more recycling. But mining is slow, capex cycles are cautious, and geology is stubborn. AISC also lags real costs (energy, labor, regulation). In other words, an elevated multiple can persist longer than valuation purists prefer if the supply curve is sticky.
• Dow/Gold is a regime thermometer, not a timing tool. The ratio compresses when either equities fall, gold rises, or both. In stagflationary or risk-regime transitions, the ratio can dwell in “expensive gold” territory for years before mean-reverting. It tells you the backdrop (capital preferring hard collateral to earnings growth), not the next 10% move.
Macro Context Still Tilts Constructive—But Conditional
On the bullish side of the ledger: geopolitical tail risks have not receded; several central banks continue to add to reserves; and inflation uncertainty lingers beneath benign headlines. Add to that stress in segments of commercial real estate, rising fiscal concerns, and market chatter about the longevity of elevated real rates—all supportive for a hedge asset with no default chain. These ingredients underpin the more optimistic path that extrapolates toward $5,000.
Yet macro is never one-directional. Growth indicators are mixed; some labor metrics are cooling; and parts of the equity market argue for a soft-landing narrative. If real yields hold firm (or grind higher) and global liquidity fails to expand, gold’s upside path becomes stair-steppy: two steps up on risk scares, one step down on data beats. In that world, consolidation is a feature, not a bug.
Microstructure & Positioning: What the Tape Is Really Saying
• Term structure and lease rates. Tight forward curves with episodic backwardation show immediate demand outpacing near-term supply. Elevated lease rates can reflect collateral scarcity or balance-sheet constraints at dealers. Sustained tightness would confirm an underlying bid; normalization would imply the rally’s pace should cool.
• ETF flows vs. vaulted bar premiums. If ETF inflows pause while physical premiums in key hubs (e.g., Shanghai, Mumbai) stay firm, it signals regional demand is still absorbing supply even as Western funds take a breather. The healthiest advances diversify their buyers.
• Futures positioning. Crowded speculative longs alongside shrinking commercial shorts warn of a shakeout risk. A balanced structure—where fresh longs are financed by new supply rather than short-covering—builds a more durable base.
Supply: High Prices Don’t Magically Create Ounces
Mine supply responds with a lag. Projects mothballed in the last down-cycle need capital, permits, and time. Grades are lower, jurisdictions are stricter, and energy-intensive processes face decarbonization hurdles. Recycling helps, but it is elastic mainly to price spikes, not steady trends. All of this argues that supply will not flood the market overnight, which allows elevated AISC multiples to persist if demand stays firm.
Demand: Three Pillars to Watch
- Official sector. Central-bank purchases are the slow heartbeat of this market. Watch whether buying broadens beyond the usual handful of names and whether monthly clips remain consistent through dips.
- Asia retail/wholesale. Chinese and Indian demand often pivots the marginal price. Premiums, festival seasonality, and import policies will matter for trend strength more than Western Twitter debates.
- Institutional portfolios. If pension funds and family offices steadily move from a 0–2% allocation toward 3–5%, even gradually, the mechanical bid dwarfs tactical ETF churn.
Scenarios: Mapping the Path Forward
Base Case — High Plateau, Range Builds
Gold digests the run above $4,000 by carving a wide range. Macro delivers alternating signals: enough uncertainty to keep dips shallow, but not enough crisis to blow off into a melt-up. In this path, gold oscillates while miners catch up on margins and supply planning. Pullbacks are bought near prior breakout shelves; extensions stall at psychological milestones ($4,250, then $4,500).
Bull Case — Toward the $5,000 Narrative
Real yields soften as growth slows faster than expected; policy turns more accommodative; a geopolitical shock or credit wobble adds urgency. Central-bank demand stays relentless; physical premiums in Asia remain sticky; ETF inflows re-accelerate. The market accepts higher clearing prices as the new normal. In this path, $4,500 falls on strong breadth and the conversation shifts from “is $5k possible” to “how long can we live above $4,800.”
Bear Case — Backfill the Breakout
Growth avoids a hard landing, inflation ebbs, and real yields grind higher. Risk assets breathe easier while central-bank buying becomes opportunistic rather than urgent. Positioning in gold looks heavy; a dollar surge tightens financial conditions. In this path, a mean-reversion move tests breakout zones—think high-$3,000s to mid-$3,000s—before the longer trend resolves.
What to Watch (A Trader’s Checklist)
- Real-rate trend: Track the direction, not just the level. A turn lower in real yields tends to re-ignite momentum.
- Central-bank disclosures: Consistency over headlines. Are monthly purchases steady through volatility?
- Physical vs. paper divergence: Do wholesale premiums and coin/bar shortages persist when futures pull back?
- Dow/Gold and Copper/Gold: If both ratios fall together, macro is tilting toward defensive growth skepticism—usually gold-positive.
- Miners’ capex guidance: Rising capex with discipline (not frenzy) is healthy; panic expansion invites future oversupply.
Positioning With Respect
Gold’s core appeal is that it is nobody’s liability. Its core risk is that it can overshoot and under-deliver for long stretches. If you’re structurally constructive, size positions so a standard 10–15% drawdown doesn’t eject you, and stage entries across time. If you’re tactical, treat weekly acceptance above each new shelf as a signal to add and a weekly close back inside as a cue to cut. For miners, respect single-asset risk and jurisdictional concentration. And if you’re using leveraged instruments, rehearse the exit before you open the trade—spreads widen when everyone wants the same door.
Bottom Line
Yes, gold looks expensive against production costs and relative to equities by some historical yardsticks. And yes, the macro mosaic still supports a higher clearing price: unsettled geopolitics, persistent diversification by central banks, and a market that continues to prize collateral simplicity over model complexity. The path to $5,000 is plausible if real yields drift lower and official-sector demand stays durable. The path to a range-bound plateau is equally plausible if growth stabilizes and liquidity stays tight. The sober stance is not maximalism in either direction; it is to let the drivers decide—real rates, official flows, physical premiums, and positioning—while you manage risk like the rally could pause tomorrow.
Note: This article is analysis, not investment advice. Markets can move sharply and unpredictably. Always do your own research and size positions to your own risk tolerance.


