
When the Fear & Greed Index Hits 10: Extreme Fear, Fragile Liquidity and How to Read the Signal
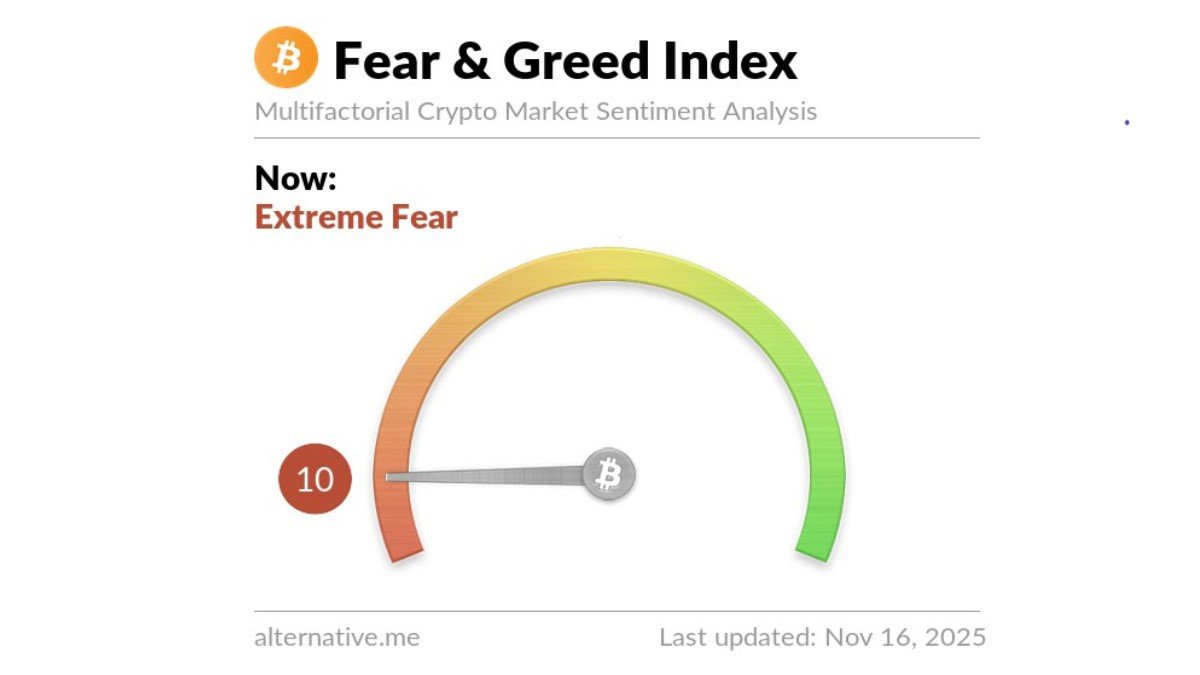
The crypto market has entered one of those rare moments when almost everyone feels uncomfortable at the same time. The composite Fear & Greed Index, which compresses a range of sentiment indicators into a single number between 0 and 100, has dropped to a reading of 10. That level sits firmly in the "extreme fear" zone and, according to several data providers, marks one of the lowest sentiment prints since earlier this year.
Prices tell a similar story. Bitcoin has recently slipped back under six figures, with intraday lows in the mid-90,000 USD range and even brief dips below that in some venues, while news outlets highlight forced liquidations running into hundreds of millions of dollars. Altcoins, as usual, have amplified the move, with double-digit declines on the day in many names and a long list of charts revisiting support zones that looked safely distant just weeks ago.
For social media, a Fear & Greed print of 10 is an excuse to spam memes about "maximum pain" or, depending on the tribe, to shout "ultimate buy signal". For a professional investor, neither reflex is helpful on its own. An extreme reading is information, not instruction. It tells you something about positioning, behaviour and the distribution of possible outcomes – but what it tells you depends on how you integrate it with price, liquidity and macro context.
This article takes the Fear & Greed Index seriously without treating it as a crystal ball. We will unpack how the index is actually built, why a reading of 10 matters, what history can (and cannot) teach about similar episodes, and how sophisticated desks use sentiment gauges as part of a broader risk framework rather than as standalone trade ideas.
1. What the Fear & Greed Index Really Measures
The first step is to be precise about the tool itself. Different platforms publish their own versions of a crypto Fear & Greed gauge, but the best known is the daily index maintained by alternative.me and mirrored by large data aggregators. It analyses the Bitcoin and broader crypto market every day and outputs a value from 0 (extreme fear) to 100 (extreme greed).
Under the hood, that single number is a weighted combination of several components. The exact weights can vary by provider, but the typical recipe includes:
• Volatility and drawdowns: unusually large price swings and deep short-term pullbacks relative to 30- and 90-day history are treated as a sign of fear.
• Market momentum and volume: strong buying on rising prices tends to push the index toward greed; heavy selling and weak demand push it toward fear.
• Social and search activity: spikes in negative language on platforms like X (Twitter) or in Google search trends – for example, searches about crashes or manipulation – are interpreted as fear signals.
• Market dominance: a rising Bitcoin dominance can indicate investors are retreating from speculative altcoins back into what they perceive as the "safer" core asset.
• Surveys and positioning: some versions of the index incorporate polling, derivatives funding data or long–short ratios from major venues to capture how traders are actually positioned.
The important point is that the index is backward-looking by design. It observes what has already happened in terms of price, volume, volatility and online behaviour, then maps those observations into a sentiment score. It does not forecast the future. Instead, it compresses the crowd’s emotional state into a gauge that can be compared across time.
When that gauge prints 10, it is effectively saying: across these inputs, the market is behaving much more nervously than usual. Prices have fallen fast, volatility has spiked, conversations have turned pessimistic and positioning has become defensive. Whether that fear is justified or excessive is a separate question.
2. Why a Reading of 10 Matters
A reading near 10 is rare enough to be noteworthy. Historical charts of the index show that extended periods below 20 are unusual; drops toward single digits have typically been associated with either late stages of deep bear markets or with violent liquidations during otherwise bullish cycles.
Recent reports put the current extreme fear print into context. Several outlets note that this is the lowest reading since the sentiment shock earlier in the year, when volatility spiked and Bitcoin briefly tested much lower levels. Others highlight that the index has been stuck in the "extreme fear" band for several days in a row rather than just flashing a one-day panic. That persistence suggests a broad deterioration in confidence rather than a single headline-driven wobble.
From a behavioural finance perspective, this matters because markets are not just collections of prices; they are collections of humans reacting to those prices. When fear is pervasive, several mechanisms tend to be at work simultaneously:
- De-risking by leveraged traders: high volatility and margin calls force derivatives traders to cut positions, contributing to further downside pressure.
- Retail capitulation: late-cycle buyers who entered near the top discover that their pain threshold is lower than they thought and exit at unfavourable levels.
- Liquidity withdrawal: market makers widen spreads or reduce inventory, meaning every market order has more price impact.
In that environment, the Fear & Greed Index is not merely a curiosity; it is a summary of how these mechanisms are interacting. A print of 10 tells you that they are all pointing in the same direction: stress.
3. History Lessons: What Happened Last Time We Were Here?
One of the most tempting uses of the Fear & Greed Index is to scroll the chart back, find previous times when the index dropped below 10 and see what prices did afterwards. That impulse is understandable; investors naturally look for patterns. Many commentaries point out that prior visits to single-digit readings have often been followed by short-term relief rallies, sometimes quite sharp ones, as forced selling exhausts itself and "bottom buyers" step in.
But there are at least three reasons to treat such pattern-matching with caution.
First, the sample size is small. Extreme fear readings are rare, so the number of historical episodes is limited. A handful of cases is not enough to build a statistically robust trading rule, especially in a market as structurally evolving as crypto.
Second, macro and micro conditions differ. The backdrop during the COVID-era crash, for example, was profoundly different from that of a late-cycle correction after a long bull run. Interest-rate regimes, liquidity conditions, regulatory news flow and ETF demand all shape how quickly risk appetite can return after a shock.
Third, the index itself can change over time. Methodologies are occasionally tweaked, data sources evolve and new sentiment channels emerge. A reading of 10 in 2025, when derivatives funding, search trends and social-media dynamics look one way, is not necessarily identical in meaning to a reading of 10 in 2018.
That said, history is not useless. It does support two broad, qualitative observations:
- Extreme fear readings often occur after a substantial portion of the price damage has already happened, not before.
- Markets can and do experience sharp counter-trend moves shortly after such readings, but those moves do not always mark the end of a larger downtrend.
In other words, a print of 10 is more compatible with the idea of late-stage stress than with early-cycle complacency. It may indicate that the risk–reward for fresh shorts is less attractive than it was earlier, and that at least a short-term oversold bounce is becoming more likely. It does not guarantee that a major bottom is in.
4. What Today’s Extreme Fear Says About Positioning and Liquidity
To make the current reading actionable, we have to connect it to what is happening in the order books, derivatives markets and funding flows right now.
Recent data releases and news coverage show a cluster of features typical of stress episodes. Bitcoin has posted large one-day ranges, including intraday drops toward the low-90,000 USD area on some platforms, followed by partial rebounds. Liquidation trackers report hundreds of millions of dollars in forced closures of long positions within 24-hour windows. Altcoins have seen outsized moves, with some large caps dropping 20% or more from recent highs in a matter of days.
On derivatives venues, funding rates for perpetual futures have swung negative at various points, indicating that traders were willing to pay a premium to stay short. Open interest has rolled over in many pairs as de-risking progressed. Spot volumes have spiked on down days, reflecting a mix of panic selling, forced deleveraging and opportunistic dip-buying by stronger hands.
All of this is exactly the kind of environment that pulls the Fear & Greed gauge into single digits. Volatility metrics jump, downside volume overwhelms upside volume, social feeds fill with bad news and search interest in words like "crash" or "liquidation" rises. The index is not creating these conditions; it is reflecting them.
For a professional desk, the key takeaway is less about "fear" in an emotional sense and more about market microstructure: liquidity is thinner, slippage is larger and the distribution of potential outcomes around any trade is wider. In such an environment, even high-conviction views need to be expressed with careful sizing and clear exit plans.
5. Short-Term Bounces vs. Long-Term Trends
The original commentary you may have seen notes that in previous instances when the Fear & Greed Index dropped below 10, the market often staged a short-term recovery as selling pressure waned and value-oriented buyers stepped in. That pattern is broadly consistent with what the historical chart shows: local sentiment extremes do tend to coincide with, or slightly lead, local price inflection points.
However, there is a crucial distinction between short-term behaviour and the long-term trend. In strong bear markets, it is entirely possible to see multiple episodes of extreme fear separated by violent rallies. Each rally feels, in real time, like it might be the start of a new bull cycle, but in hindsight it turns out to have been a bear-market bounce on the way to lower lows.
Conversely, during a broader bull market where macro conditions, ETF flows and structural adoption all favour risk assets, an extreme fear reading following a sharp correction can indeed mark the kind of "shakeout" that clears out weak hands before the uptrend resumes. Determining which of these regimes we are currently in requires a separate macro and on-chain analysis; the index alone cannot answer that question.
A disciplined way to think about it is this: the Fear & Greed Index is a timing tool for sentiment, not a directional tool for fundamentals. It can help you avoid selling at the point of maximum pain or buying at the point of maximum euphoria, but it should not replace fundamental work on adoption, regulation, innovation or liquidity.
6. Using Fear & Greed Like a Professional, Not a Meme
So how do institutional desks and serious individual investors use a reading of 10 in practice? In our work with clients and in our own analysis, three approaches stand out.
1. As a regime flag, not a trade trigger. A plunge into extreme fear tells you that the market has shifted into a stress regime. That has implications for everything from leverage limits to stop-loss distances. Many risk frameworks explicitly tighten limits when volatility and sentiment cross pre-defined thresholds, regardless of whether the desk is net long or net short.
2. As a filter for narrative. In extreme fear, bearish narratives dominate headlines and social feeds: exchange rumours, regulatory fears, doomsday price targets. Knowing that the index is at 10 helps you discount some of that noise. Similarly, when the index is in extreme greed, bullish narratives – "institutions will never sell", "this time is different" – deserve extra skepticism.
3. As a complement to technical and on-chain signals. Some strategies look for alignment between sentiment extremes and other indicators: oversold oscillators, on-chain capitulation metrics, funding squeezes or liquidity pockets. A cluster of signals – for example, extreme fear plus exhausted sellers plus large spot inflows – can justify taking measured contrarian risk. But if sentiment is extreme while other metrics still show complacency or structural weakness, the index reading on its own is not enough.
In all cases, the goal is to use Fear & Greed as one input into a process, not as a shortcut around that process.
7. Risk Management in a Market That Is Already Afraid
The final part of the original summary you provided makes an important point: when the index sits at 10, it may be a good time to observe more carefully, not to act impulsively. From a risk-management perspective, this is exactly right.
In a high-fear regime:
- Slippage and gaps are larger. If you need to exit in a hurry, the price you get may be far worse than the last traded level on your screen.
- Correlation goes to one. Assets that usually diversify each other start moving together as investors sell what they can, not just what they want to.
- News sensitivity is heightened. A headline that would normally move the market by 1–2% can trigger 5–10% swings when everyone is already on edge.
These conditions argue for smaller position sizes, clearer contingency plans and an honest assessment of one’s own emotional tolerance. Fear & Greed at 10 does not just describe "the market"; it describes the environment in which you will be asked to make decisions. Recognising that you are operating in an emotionally charged setting is part of staying rational.
It is also a reminder that standing aside is a legitimate position. Professional traders are under constant pressure to "do something", but some of the best decisions in extreme environments involve reducing risk, waiting for volatility to normalise and letting the market show its hand rather than trying to guess the exact tick of the low.
Conclusion: Extreme Fear Is a Signal of Stress, Not a Promise of Safety
The Fear & Greed Index dropping to 10 is a clear sign that the crypto market has shifted into an emotionally and structurally stressed state. Volatility is elevated, forced liquidations have done damage, social and search activity are dominated by anxiety, and liquidity conditions have deteriorated. Historically, such episodes have often been followed by short-term relief rallies as selling pressure subsides – but they have not always marked the end of larger downtrends.
A professional approach treats the index as a useful but incomplete piece of information. It can help you avoid the most emotionally driven mistakes: panic-selling into a hole or chasing parabolic moves at the top. It can also act as a regime flag for risk management, telling you when to tighten limits and focus more on capital preservation than on aggressive risk-taking.
What it cannot do is absolve you from doing the harder work: understanding macro conditions, following regulatory developments, analysing on-chain data and appraising project fundamentals. The right question is not "Fear & Greed is 10 – should I buy or sell?" but rather "Given that sentiment is at an extreme, how should that shape my risk, my time horizon and my interpretation of the other signals I see?"
In a market that lives at the intersection of technology, macro and human psychology, there are no perfect indicators. But there are honest ones. A Fear & Greed reading of 10 is brutally honest: traders are scared. What you do with that information is where analysis, discipline and edge still matter.


