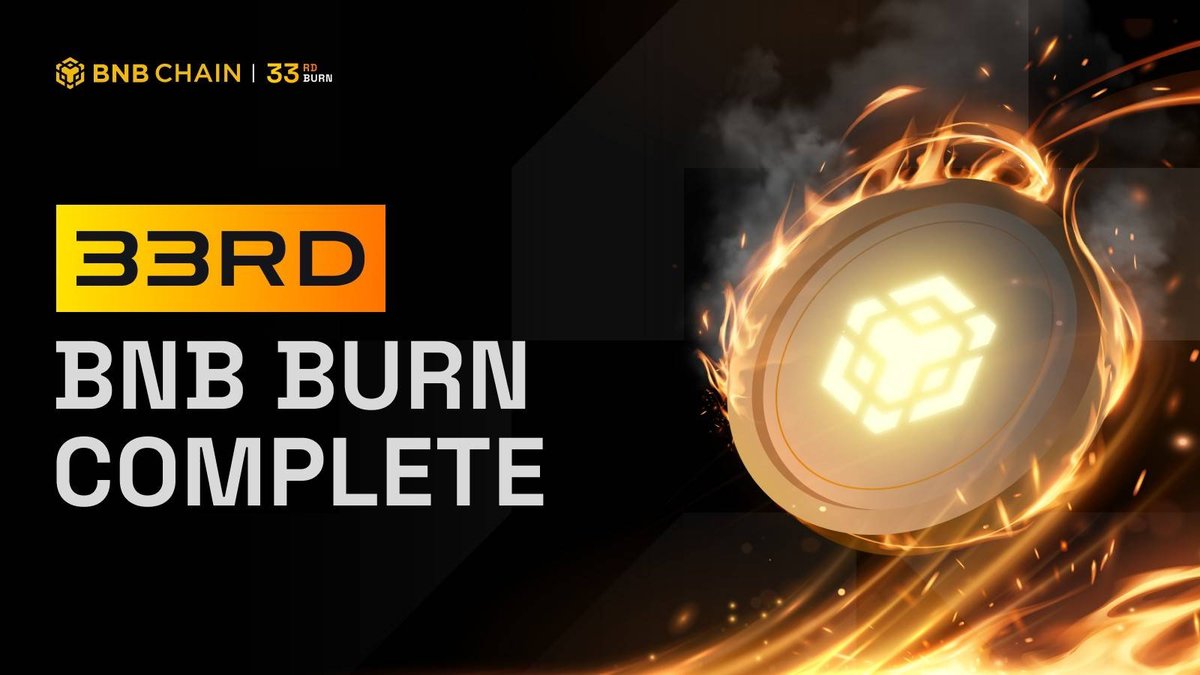
BNB Chain Completes the 33rd Quarterly Burn (~$1.2B): What It Really Means for BNB’s Long-Term Value
Quick take: BNB Chain has executed its 33rd quarterly burn, removing 1,441,281 BNB from circulation (roughly $1.2B at the time). The headline number is striking, but investors should focus on the mechanics behind supply reduction and the demand that ultimately supports price. BNB’s supply policy is driven by two engines: (1) the Auto-Burn formula (quarterly supply removal that references price and on-chain activity) and (2) BEP-95 Real-Time Burn (a share of gas fees burned at the protocol level in every block). Together they create a disciplined, transparent path toward a lower total supply, but price appreciation still depends on real network usage.
1) The Two Burn Engines, Explained
Auto-Burn (quarterly): A rules-based mechanism that removes BNB every quarter using a formula tied to the token’s average price and network activity. When activity is high and/or price is lower, the formula often results in larger burns. This makes the supply path more predictable and underpins the stated long-run goal of converging toward 100 million BNB.
BEP-95 (real-time): Introduced to burn a portion of gas fees automatically at the protocol layer. The more the network is used, the more fees are burned. In other words, throughput and engagement translate into continuous supply reduction that markets can verify on-chain.
Why both matter: Auto-Burn provides a policy backbone you can model each quarter, while BEP-95 reflects live demand at a block-by-block cadence. The combined effect is a supply schedule that is both disciplined (quarterly) and elastic (usage-driven).
2) Reading the 33rd Burn the Smart Way
The number “1,441,281 BNB” will dominate headlines. But sophisticated investors ask different questions:
- What share of total supply does this burn represent, and what is the 12-month trailing pace (TTM) of total burns?
- How does TTM burn compare to any issuance/incentive flows that may increase circulating supply?
- More importantly, is network demand strengthening—so that BEP-95 burns and utility-led sinks remain robust in down cycles too?
Large burns are a necessary condition for sustained scarcity—not a sufficient one. For scarcity to affect price, the network needs durable, growing utility that keeps coins off exchanges and continuously converts activity into fee burns.
3) Why BEP-95 Is the Long-Run Engine
BEP-95 turns real usage—DEX volume, perpetuals trading, social transactions, gaming, payments—into a constantly operating 'supply throttle.' As these verticals deepen, the burn scales organically. That is healthier than discretionary, ad-hoc buybacks because the signal is transparent and directly tied to user behavior rather than a treasury decision.
The trade-off is cyclicality: during quiet markets, BEP-95 burn decelerates. This is why we recommend tracking MA-30/MA-90 of daily BNB burned under BEP-95 to smooth noise and focus on trend health.
4) Benchmarking Against Ethereum and Others
Ethereum’s EIP-1559 also burns the base fee, sometimes pushing ETH net supply negative during peak activity and slightly positive in quieter times. ETH, however, lacks a separate, quarterly “policy lever.” BNB’s twin approach (Auto-Burn + BEP-95) is unusual: it mixes policy discipline with usage sensitivity.
Other L1/L2s often rely on extremely low fees for UX. That’s great for growth, but the burn impact per transaction is typically small—requiring very high throughput to matter. Some ecosystems implement discretionary buyback-and-burn tied to revenue, but those can be opaque or changeable. Relative to peers, BNB’s supply framework is codified and auditable.
5) Demand is the Real Valuation Driver
We break BNB demand into four buckets:
- Gas demand: More transactions and higher-value use cases generate higher burns and signal stickier adoption.
- Ecosystem utility: Using BNB for fee discounts, launchpools, staking/earn products, and on/off-ramp functionality integrates BNB into day-to-day activity.
- Policy premium: Markets tend to reward tokens with consistent, transparent supply rules—especially when paired with observable, on-chain burn data.
- Cycle beta: Macro liquidity and risk appetite can lift all boats, but without real utility the effect rarely persists.
6) A Practical Valuation Lens: EV / Network Activity Proxy (NAP)
Discounted cash flow rarely fits non-cash-flow tokens. Instead, build an NAP—a weighted proxy of total fees, gas used, DAU/MAU in flagship dApps, and net on-chain volumes. Apply a multiple range based on growth, competitive moat, and risk regime. Then adjust for burn by treating (Auto-Burn TTM + BEP-95 TTM) as a 'perpetual supply rebate' that increases per-token exposure to the same activity base over time.
This doesn’t produce a single “true” price; it produces ranges with explicit levers you can monitor monthly.
7) What to Do (and Not Do) After Burn #33
Do: Track MA-30/90 BEP-95 burn, fees, and gas used. Follow opBNB and Greenfield roadmap execution. Watch whether flagship dApps achieve PMF (product-market fit) where revenue outpaces incentives.
Don’t: Equate a big quarterly burn with immediate price jumps; over-leverage on PR headlines; ignore regulatory, infra, or bridge risk.
8) What Game Is BNB Playing?
If Ethereum is a multi-hub financial city and Solana is a high-speed expressway, BNB’s strategy is utility-first and product-driven: prioritize low-cost, fast UX to capture mass-market volumes; convert throughput into structural scarcity via BEP-95; and leverage distribution through the broader Binance ecosystem. In that context, the 33rd burn is a policy milestone—but sustainable upside still depends on usage.
9) Key Questions Post-Burn
- Should BEP-95’s rate increase? Too aggressive a burn could reduce validator economics and weaken security. “Sufficient and stable” beats “maximal and brittle.”
- Can opBNB become a demand engine? If it attracts perps/social and other high-frequency apps, throughput rises materially and BEP-95 amplifies. If opBNB remains a me-too EVM L2, demand will fragment.
- Are additional demand sinks needed? Locking/staking mechanisms or predictable buybacks could help, but simplicity and predictability are paramount.
10) Risk Checklist
- Regulatory: Policy shifts in key jurisdictions can dampen risk appetite for large-ecosystem tokens.
- Security: Smart-contract, validator, MEV, or bridge incidents can reset market confidence overnight.
- Competition: Ethereum L2s and Solana are scaling; BNB must defend its UX, cost edge, and distribution.
- Macro: Strong USD/tight liquidity compress multiples even if the burn remains consistent.
11) A Minimalist Monitoring Dashboard
- Supply-side: Auto-Burn TTM (rolling four quarters), BEP-95 MA-30/90 (BNB/day), total/circulating supply and free float.
- Demand-side: Transactions/day, gas used/day, active addresses (BSC/opBNB), total fees, and median fee; DAU/MAU and revenue of core dApps (DEX, perps, social, gaming).
- Ecosystem health: Dev activity (commits/releases), share of incentives with measurable ROI, validator diversity, bridge stability, uptime.
12) 12–18 Month Scenarios
Bullish: opBNB gains traction with perps/social; throughput and fees climb; BEP-95 TTM rises steadily; Auto-Burn remains disciplined; new utility sinks add stickiness. NAP expands and the valuation band shifts higher.
Base case: Uneven activity; BEP-95 burn oscillates; Auto-Burn continues but demand grows in fits and starts. Price tracks macro liquidity cycles; burn acts more like a “floor” than a growth engine.
Bearish: Adverse regulation and/or infra incident; competitor ecosystems capture share. Burn cannot offset persistent net selling; multiples compress.
Bottom Line
Quarterly Burn #33 demonstrates BNB’s supply discipline. However, long-term value will be decided by utility: the volume and quality of transactions that continually engage BEP-95 and keep BNB off exchanges. If BNB can compound user-centric apps, scale opBNB/Greenfield, and maintain its low-cost, fast UX at scale, the twin burn engines will amplify scarcity rather than merely decorate quarterly reports.
Disclaimer: This report is for informational and educational purposes only and does not constitute investment advice. Digital assets are volatile; do your own research and manage risk accordingly.


