Executive Summary
On-chain and market analytics shop Santiment notes that Bitcoin (BTC) has broken step from the S&P 500 (SPX): over the last week, the index slipped roughly 1.6% while BTC fell about 12%, pressing toward the psychological 100,000 level. In a market that, since 2022, has broadly respected a common risk cycle across stocks and crypto, such a gap is unusual. Santiment frames it as an overextension—a 'rubber band' effect that tends to snap back when selling pressure reaches exhaustion.
Our view: the decoupling can be constructive, but only if it reflects crypto-internal deleveraging against otherwise stable macro conditions. That is, if equities and gold remain orderly while BTC pukes on leverage unwinds, the probability of a spot-led rebound rises. Conversely, if the divergence is signaling a funding vacuum (weak ETF creations, contracting stablecoin supply) or a holder regime change (older cohorts distributing), the same 'rubber band' can keep stretching.
What Makes This Decoupling 'Rare'
Since the Fed’s hiking cycle matured, BTC and SPX have traded with a positive—though time-varying—rolling correlation. The mechanism is straightforward: global liquidity, real yields, and USD direction drive the price of risk across assets. When financial conditions ease, both rise; when they tighten, both fall. Against that baseline, a double-digit Bitcoin decline while SPX barely budges suggests idiosyncratic crypto forces are at work.
There are three common families of decoupling:
- Flight-to-Quality Decoupling: Macro shock lifts USD/real yields; stocks wobble; BTC underperforms. Typically bearish for crypto.
- Crypto-Idiosyncratic Decoupling: A leverage unwind, exchange-specific stress, or protocol news hits crypto while macro is calm. Often mean-reverting if the plumbing clears.
- Liquidity-Allocation Decoupling: New capital prefers conventional risk (equities) while crypto waits for catalysts; BTC bleeds slowly even as SPX grinds. This can be neutral to mildly bearish until inflows restart.
Last week’s tape—orderly stocks and gold, pressure concentrated in perps and high-beta alts—looks most consistent with Crypto-Idiosyncratic dynamics.
Why an Oversold Read Is Plausible
Markets do not bottom on bad news; they bottom when sellers run out of inventory. In crypto, that exhaustion has a distinctive footprint:
- Funding Compression: Perpetual swap funding shifting toward flat/negative after trending rich indicates long crowding has been washed out.
- Basis Mean Reversion: Futures-spot spreads (basis) narrowing back to mild contango from a stressed state suggests forced selling has abated.
- Term-Structure Normalization: Front-end implied volatility cools relative to back-end, a post-event hallmark as hedges unwind.
- Spot Leadership: Recoveries led by spot volumes (including ETF prints) rather than perps imply durable buying.
Layered over a week where SPX was only modestly lower, the pattern argues for a crypto-internal flush rather than a macro de-risking. That is the essence of Santiment’s 'rubber-band' framing: a short, violent stretch that invites snapback once the mechanical sellers finish.
The Rebound Is Not Automatic: Flow Decides
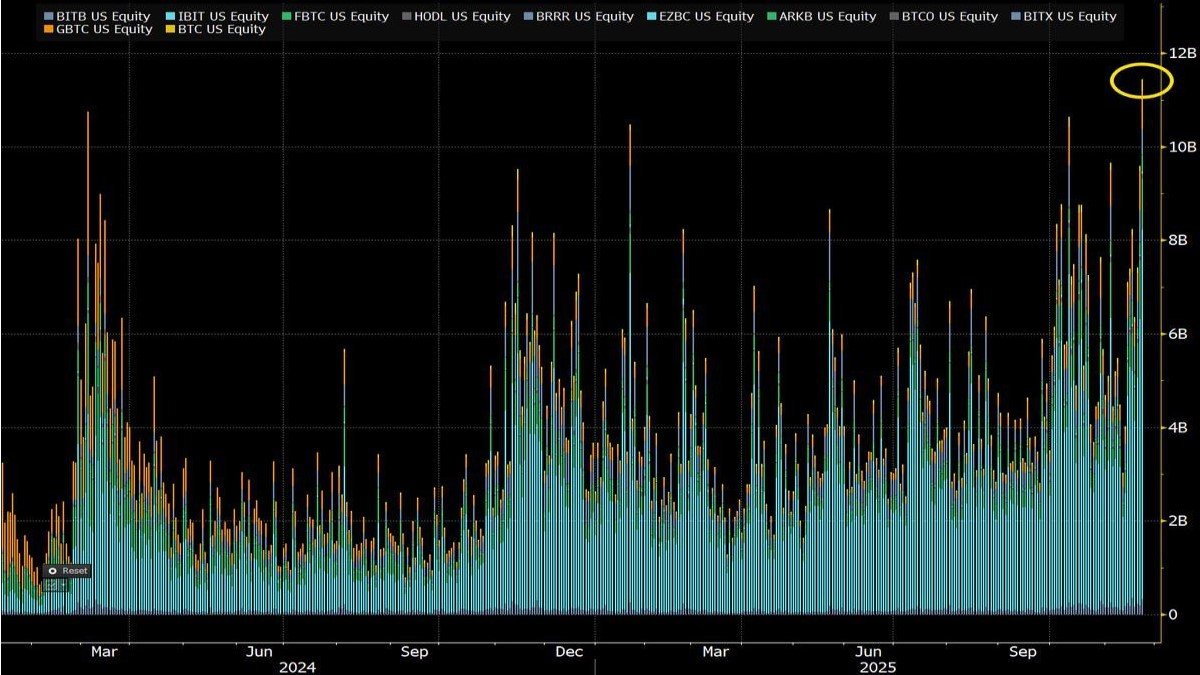
There is a critical difference between oversold and under-bid. Oversold conditions can persist if fresh cash is not arriving. In 2024–2025, BTC’s durability has increasingly hinged on fiat rails—spot ETF creations, stablecoin issuance, and bank/broker on-ramps. When these are positive on a rolling basis, dips become reloads. When they stall, dips become drifts.
Hence our rule-of-thumb: treat decoupling as bullish only if (1) ETFs print net creations across multiple sessions; (2) aggregate stablecoin float rises week-over-week; and (3) perp funding normalizes without re-leveraging too quickly. Without those, a 'rubber band' can remain taut for uncomfortable lengths of time.
A Forensic Look at the Divergence
1) Macro Tape Check
Equities: A 1–2% SPX pullback against a double-digit BTC drawdown argues against system-wide risk aversion. Credit: No broad stress implies funding markets remain open. Gold: Stability signals that defensive hedges are not being urgently repriced. USD & Real Yields: If they are not spiking, crypto’s drawdown is less likely to be macro-driven.
2) Crypto Microstructure
Into policy weeks or headline-heavy periods, perps crowd long and options skew steepens. The classic post-event choreography is a sharp liquidation cascade as late longs are forced out, then a slower stabilization as options vol bleeds. If spot buyers (ETF desks, high-touch OTC, large retail) step in, the bounce sticks; if only perps re-lever, the bounce fades.
3) On-Chain Cohorts
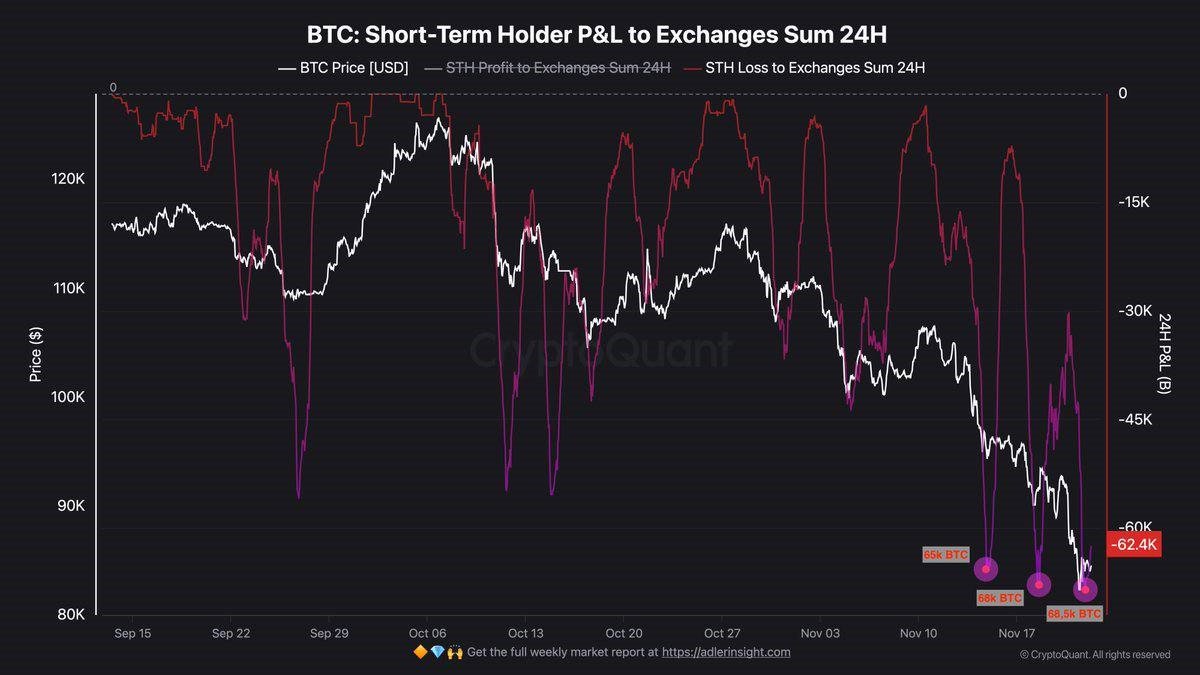
Healthy resets show younger coins turning over at losses (short-term capitulation) while older cohorts (6–12 months+) remain relatively quiet. If, by contrast, the 6–24 month bands accelerate spending, decoupling can morph into a distribution event that requires time to absorb.
Measuring the 'Rubber Band' Without Fooling Ourselves
It is easy to data-mine correlations. A more honest framework:
- Spread Z-Score: Compute a short-horizon z-score of BTC returns minus beta-adjusted SPX returns. Readings beyond ±2 often revert toward zero, conditional on neutral macro.
- Rolling Correlation Buckets: Compare 10-, 20-, and 60-day BTC–SPX correlations. A split (10d low, 60d high) flags a local divergence within a still-positive medium-term regime.
- Volatility Ratio: Track realized vol ratios (BTC/S&P). When BTC vol overshoots without macro confirmation, expect partial mean reversion.
- Flow Triangulation: Pair ETF primary flows, stablecoin supply changes, and on-exchange stablecoin balances. Two out of three positive = constructive.
Why Stable Stocks and Gold Are a Feature, Not a Bug
Santiment highlights that equities and gold have remained steady. That matters. It means the 'risk-free' anchor (Treasuries) and the 'macro hedge' (gold) are not signaling an acute policy or growth shock. In such a backdrop, crypto pain usually maps to positioning rather than policy. That is precisely the environment where oversold crypto can spring back—provided fiat intake resumes.
Scenarios: From Snapback to Slow Drip
1) Mean-Reversion Snapback (Constructive)
What it looks like: Two to four consecutive sessions of net spot ETF creations; aggregate stablecoin float ticks higher; perp funding normalizes to slightly positive after going negative; basis returns to mild contango. Price reclaims key moving averages with spot-led volume, and dominance stabilizes.
Mechanics: Funds that paused allocations during the drawdown resume buying; options vol bleeds, pushing dealers to buy dips; shorts cover into strength.
Risks: The rally re-levers too quickly, with funding spiking before spot breadth broadens—inviting another flush.
2) False Positive (Distribution Under the Surface)
What it looks like: A sharp 5–8% bounce on perps with shallow spot volumes; ETF flows mixed; stablecoin supply flat to down; older cohorts quietly distribute into strength. Price forms lower highs and loses momentum within a week.
Mechanics: Bounce fuel comes from shorts and dealers; without fresh cash, every uptick meets supply.
Risks: Traders misread a mechanical rally as trend resumption and get trapped as liquidity thins.
3) Downtrend Confirmation (Macro Turns Hostile)
What it looks like: DXY and real yields trend higher, credit widens, equities roll; ETF prints flip to net redemptions; stablecoin float contracts. BTC fails retests, breadth deteriorates, and realized correlation rises again—but downward.
Mechanics: The decoupling was the canary—crypto sensed tightening first. Without macro relief, bounces are sold and volatility clusters lower.
Checklist: Signals That the 'Rubber Band' Is Snapping Back
- Flows: Multi-session net creations in spot ETFs; week-over-week stablecoin supply growth; rising on-exchange stablecoin balances.
- Leverage Reset: Funding between -0.01% and +0.02%/8h on major venues; CME and top exchange basis back to low single-digit annualized contango.
- Vol Normalization: 7–10 day implied volatility cooling relative to 30–60 day; skew flattening from extreme put preference.
- Spot Leadership: Higher spot share of total turnover on up days; OTC desks report two-way flow with buy-side bias.
- Breadth: Percentage of top-100 assets above 50DMA rising; BTC dominance either steady (risk-on rotation later) or gently higher (safety within crypto first).
Positioning the Trade: Professional Playbook
For discretionary macro/crypto funds: Treat the first bounce as a test, not a victory lap. Scale into strength only after flow confirmation (ETFs + stablecoins) and a day of spot-led breadth. Use invalidation levels (e.g., the post-flush low) rather than vague 'wait and see' language.
For options traders: Vol sells best after the panic. Consider call spreads or diagonal structures that monetize front-end vol decay while retaining upside. Avoid naked short vol until funding stabilizes; 'leverage plus short vol' is how good months die.
For long-only allocators: A three-tranche plan reduces regret: add 1/3 on ETF creations turning positive (5-day sum), 1/3 on stablecoin float turning positive week-over-week, 1/3 on a spot-led reclaim of key moving averages. If any signal flips negative for a week, pause.
For miners/treasuries: If cash runway is tight, use rebound days to term out sales via TWAPs rather than market orders. Lock in 3–6 months of opex in stables so you are not a forced seller into any second-leg lower.
For retail tacticians: Favor BTC and the deepest liquidity pairs first. Let alt rotations come after spot breadth improves and funding stays tame for several sessions.
Why This Isn’t Just Another 'Buy the Dip' Article
Most commentary stops at correlations and adjectives. Our approach is operational: we specify which flows must turn (and for how long), which microstructure gauges must normalize, and how to stage risk. If those toggles flip, the Santiment decoupling insight gains teeth; if not, it remains an interesting chart that didn’t pay.
Counterarguments—and How We’d Falsify the Bullish Read
- 'Equities are not a safe anchor.' If SPX stability masks narrow breadth or credit widening, crypto could be sniffing real stress early. Falsification: Rising real yields and stronger DXY alongside ETF outflows = stand down.
- 'It’s not leverage, it’s holders.' If 6–24 month coins accelerate distribution, the drawdown reflects fading conviction, not a perp flush. Falsification: Elevated realized losses from older cohorts + weak spot bids = no quick snapback.
- 'Funding will re-lever too fast.' Even if flows improve, a fast surge in funding to rich positives before spot breadth broadens sets up a second flush. Falsification: Funding >0.03%/8h on multiple venues within 48h of the bounce without ETF confirmations = trim risk.
Practical Analytics You Can Track Daily
- ETF Dashboard: Rolling 5- and 10-day creations/redemptions; watch for inflections rather than one-off prints.
- Stablecoin Monitor: Net supply changes (USDT/USDC and regional variants); on-exchange balances as a proxy for dry powder.
- Funding & OI: Venue-weighted funding rates and open interest; look for OI down, funding neutralizing—an unwind signature.
- Term Structure: 7/30/60-day implied vol curves; healthy rebounds often travel with front-end vol bleed.
- Breadth & Dominance: Share of top assets above their 50DMA and BTC dominance trend.
Bottom Line
Santiment’s observation of a BTC–SPX decoupling is not just trivia; it is a map to where the next move will come from. If equities and gold remain orderly while crypto prints the classic deleveraging signature—and if fiat rails turn back on—this is the kind of oversold stretch that resolves higher. If the rails stay dry, the same stretch can morph into a slow drift or a second leg lower. The difference is measurable, and the playbook is actionable.