When the Bid Steps Away
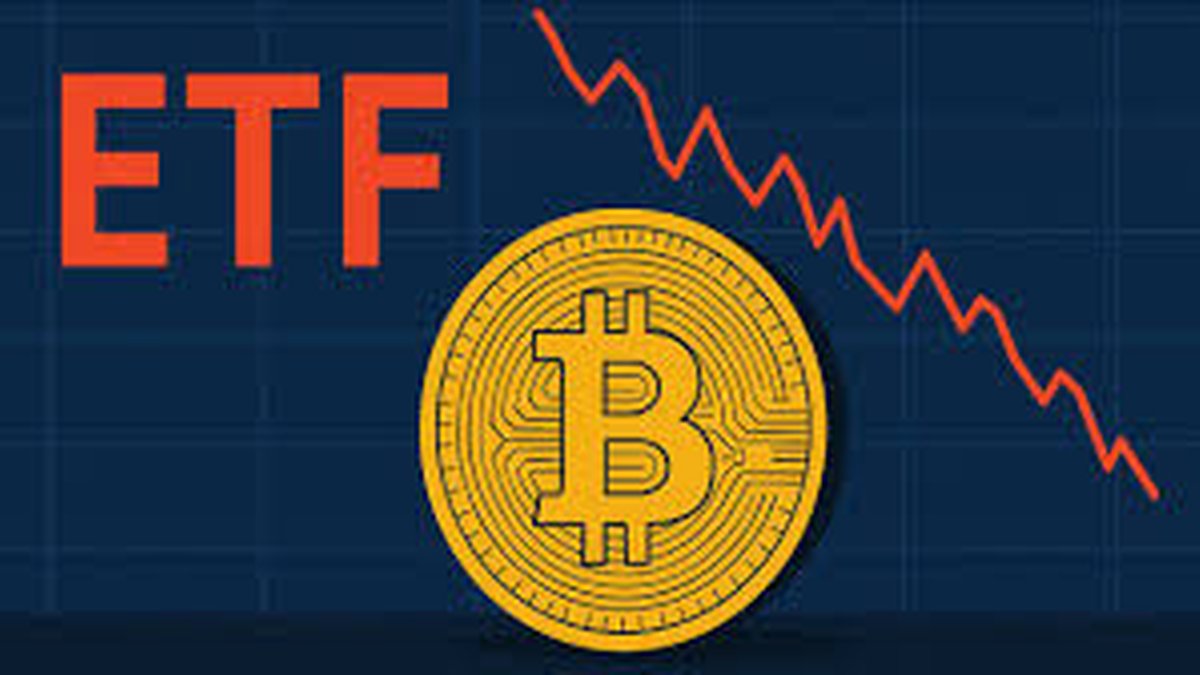
On November 13, 2025, U.S. spot Bitcoin ETFs recorded net redemptions of $866.7 million, the second-worst one-day outflow since launch, according to Farside Investors’ daily dashboard. The table shows widespread red on the day across the complex — including outflows at iShares (IBIT), Fidelity (FBTC), and significant redemptions from GBTC — culminating in a deep negative print on the total line. The following session (Nov 14) logged additional net outflows, albeit smaller in aggregate. In parallel, U.S. Ethereum ETFs saw $259.6 million of outflows on Nov 13 and a further $258.8 million on Nov 14, extending the pressure on the other bellwether. Together, those numbers explain why intraday bounces felt fleeting: large, mechanical sellers pressed into a tape with thinned liquidity and defensive risk management.
Context matters. The -$866.7M day sits just behind the all-time worst daily outflow near late February (-$1.11B total), a reminder that ETF flows can swing hard in both directions. If you’ve traded any portion of this cycle, you’ve seen how these flows interact with futures basis, market-maker inventory, and CEX order books. What looked like “sudden weakness” was, in truth, a classic withdrawal of passive demand coupled with concentrated redemption prints that arrived while dealers were already leaning light. In this piece we break down what exactly happened, why it happened, and how to position around the next liquidity regime shift.
What the Data Actually Says
We anchor on three facts:
1. Bitcoin ETFs: -$866.7M on Nov 13. The aggregate total for U.S. spot Bitcoin ETFs registered negative eight hundred sixty-six point seven million dollars that day, the second-largest daily outflow on record and the worst since late February’s capitulation print (minimum around -$1.11B). ([Farside][1])
2. Follow-through the next day. Nov 14 posted another negative total (roughly -$492M), confirming that redemptions were not a single-ticket anomaly. ([Farside][1])
3. Ethereum ETFs also bled. U.S. ETH ETFs printed -$259.6M on Nov 13 and -$258.8M on Nov 14 — a synchronized draw that reinforced risk aversion and reduced cross-asset beta support. ([Farside][2])
Those are facts about fund flows, not interpretations. The interpretation starts when you ask who redeemed, why those redemptions clustered, and how the plumbing translated into price action.
The Four Engines Behind an Outflow Shock
While every outflow day has its own catalyst cocktail, four repeatable engines typically power big negative prints:
1) Tax-aware risk reduction from discretionary allocators
Real-money accounts often size Bitcoin ETF exposure in “tracking units” that are easy to scale up or down. When macro uncertainty rises — delayed data releases, stop-start policy signaling, or cross-asset volatility — the cleanest risk lever is trimming ETF units. The Nov 13 tape carried exactly that vibe: institutions yanked a portion of the beta sleeve without touching operating mandates elsewhere.
2) Basis normalization forced by funding and term structure
During uptrends, futures basis (perp funding and dated futures spreads) provides a carry subsidy for long exposure. When price breaks and basis compresses, some levered players unwind the long-spot/short-futures basis trade or de-risk ETF longs paired with futures shorts. The unwind removes a systematic, price-insensitive bid — multiplying the impact of even modest redemptions.
3) Dealer balance-sheet constraints in a thin overnight
APs (authorized participants) and ETF market makers warehouse exposure intra-day while creating/redeeming ETF shares. On “flow shock” days, dealers widen spreads and raise creation/redemption costs to protect inventory. That raises the “friction” of providing liquidity, so more flow hits the tape at worse levels. The result looks like air pockets in the price: gaps down, shallow bounces, and failed retests.
4) Feedback loops from quant risk controls
CTA and vol-targeting models react to realized and implied volatility. When the vol regime steps up, those models sell beta, including crypto proxies. If that selling hits the same sessions as ETF redemptions, the combined effect is larger than either flow alone. You saw that combination in the synchronized BTC and ETH outflows on Nov 13–14.
How ETF Redemptions Transmit Into Price
Think of three layers of transmission:
1. Primary market: Investors redeem ETF shares. APs deliver the underlying (BTC or ETH) back to ETF sponsors, or receive assets and sell them depending on structure. Either way, primary-market activity forces hedges to be lifted or put on.
2. Dealer hedging: Market makers offset risk in futures and spot. On outflow days, they often unwind long futures/spot hedges, pushing prices lower and compressing basis.
3. Secondary spillovers: As price declines, perp funding drops and forced deleveraging begins for the most leveraged longs. The absence of immediate dip-buyers (because many are the very ETF allocators redeeming) lets the path overshoot.
That’s why blocks of outflows often correlate with day-of weakness and a more subdued tape for several sessions afterward. The nuance: sometimes flows are lagging indicators of sentiment — you get the big outflow after the acute selloff — and other times they’re a leading edge. What distinguishes the two is usually the behavior of basis and the location of liquidity.
Why Now? A Microstructure View
Heading into mid-November, the market had digested weeks of choppy macro communications and fitful risk-on in equities. Crypto’s internal plumbing looked tired: perp funding had normalized, long/short positioning leaned long after tactical squeezes, and option skew showed preference for downside hedges. That’s the background against which ETF outflows hit. In other words, redemptions arrived when the market had already raised its sensitivity to bad news. The surprise wasn’t the outflow; it was the clustering across BTC and ETH on consecutive days.
Is This a Top or a Mid-Cycle Purge?
Investors want a simple answer. The market rarely obliges. The better question is risk-adjusted odds across time horizons:
• 1–3 weeks: After a second-worst outflow day, markets frequently seek a new equilibrium range while basis rebuilds. Historically (including February’s -$1.11B episode), the first bounce tends to be tradable but not immediately durable unless inflows resume quickly. ([Farside][1])
• 1–3 months: If total ETF ownership is stable and macro isn’t deteriorating, outflow clusters often mark the midpoint of consolidation, not the end of cycle. The key tell is a pivot to net zero or modest inflows within 10–20 trading days, alongside a re-steepening of futures term structure.
• 6–12 months: The secular bid survives as long as large allocators view Bitcoin as a strategic hedge or return diversifier. That bid does not preclude drawdowns; it raises the floor over time.
Signals to Watch From Here
1. Daily ETF totals and breadth: One big negative day is survivable; a sequence of negative days is regime-defining. Breadth matters: if outflows concentrate in one product (e.g., legacy conversions) while newer funds stabilize, that’s healthier than across-the-board red.
2. Basis and funding: Sustainable recoveries almost always coincide with positive and rising basis on dated futures and normalized perp funding.
3. Dealer inventory and spreads: On-chain and microstructure proxies (e.g., depth at 1%/2%, CEX spot spreads) improving from stressed levels signal that market makers are comfortable warehousing risk again.
4. Correlation with equities: When crypto de-couples on the downside and stays weak while stocks stabilize, it usually reflects internal flow stress that must resolve before trend resumes.
Who Was Likely Selling?
Without account-level disclosure, we infer from behavior:
- Tactical macro funds trimming high-beta allocations to manage VaR into year-end. These are not crypto-native constraints; they’re portfolio-level risk controls.
- ETF arbitrageurs reversing creations done during the prior week’s strength, as basis and borrow economics turned less attractive.
- Retail capitulation via advisors and robo platforms that auto-rebalance risk. The sign here is synchronized selling across BTC and ETH wrappers — and we saw exactly that.
Counter-Flows: Why Outflows Don’t Automatically Mean “Downtrend”
Outflows describe net behavior on a day, not a thesis for an entire cycle. Remember February’s record outflow: it did not end the bull cycle. It marked a re-set. The question is whether redemptions abate and whether structural demand (corporate treasuries, international wealth channels, and institutional mandates) replenishes the bid. Historically, that’s been a function of volatility calming, not just price levels. When realized vol compresses, allocators are more willing to step back in — and ETF flows flip.
Scenario Map (Next 4–8 Weeks)
1) Stabilization + Gradual Inflows (Probability 45%)
ETF totals oscillate around flat to modestly positive, futures basis rebuilds, and options skew relaxes. Price carves a range with higher lows. Strategically, this is where dollar-cost averaging and cash-secured put selling (for sophisticated investors) make sense: you’re paid to wait for the range to break.
2) Prolonged Outflow Drip (Probability 35%)
Net outflows persist but shrink in size. Price bleeds lower with intermittent squeezes, ETH underperforms as PoS rewards narratives fade, and correlations to equities rise. The market remains tradable, but not investable, until breadth turns.
3) Capitulation Then Rip (Probability 20%)
Another -$1B class day prints, leverage is flushed, and depth collapses. Two to five sessions later, flows flip hard positive, basis surges, and BTC snaps back. This path is emotionally brutal but mechanically clean, and it has historical precedent.
Tactics for Different Participants
For long-only investors
Decouple your decisions from daily flow prints. Size positions so that another -20% tape is emotionally and mathematically survivable. Use staged entries around objective structure (weekly demand zones, 20/50/200-DMA clusters) and avoid leverage while ETF flow trend is negative.
For discretionary traders
Anchor to the basis: if dated futures spreads re-expand and perp funding stabilizes above zero for consecutive sessions, it’s usually safe to upgrade risk. Until then, trade ranges with tight risk, and fade the first test of broken MAs rather than chase breakouts.
For risk managers
Watch for breadth of ETF flows and depth on CEX L2s. If breadth improves and depth returns, you can relax hedges and widen stop-loss distances to reduce noise. If outflows stay broad and depth remains thin, keep gross exposure low and favor convexity (options) over delta.
What Would Flip the Tape?
- Net inflows on two of three consecutive sessions across both BTC and ETH ETFs — the simplest, cleanest tell that passive demand has returned. ([Farside][1])
- Term structure steepening without an accompanying spike in implied vol — a sign that demand is buying the right to be long out in time, not just short-covering.
- Improved on-chain distribution (e.g., reduced exchange reserves while price rises) — indicating that coins are moving to stronger hands rather than hot wallets.
The Big Picture: Flows Are a Feature, Not a Bug
Spot crypto ETFs industrialize ownership. Industrial ownership means institutional behaviors — quarter-end rebalancing, VaR trims, basis-arbitrage — become core drivers of short-term price paths. That’s not bearish. It’s the price of mainstreaming. The payoff is that, over full cycles, the investor base deepens and the floor rises. Between here and there, you will live with flow shocks. Treat them like weather systems: prepare, don’t predict.
Bottom Line
Nov 13’s -$866.7M outflow was a material liquidity event — second only to February’s record daily redemptions — and it arrived alongside heavy ETH ETF outflows. The immediate effect was to drain passive demand, compress basis, and elevate volatility. Whether this marks a top or a mid-cycle purge depends less on any single headline and more on the behavior of flows from here, plus the recovery of depth and term structure. Until breadth improves and basis re-steepens, respect the range and pay for convexity where you can.
In other words: flows started the fire; microstructure decided how far it spread. Watch the plumbing — it will tell you when the flames are out.


