
1.26 Billion Dollars Liquidated in 24 Hours: Anatomy of a Crypto Flush
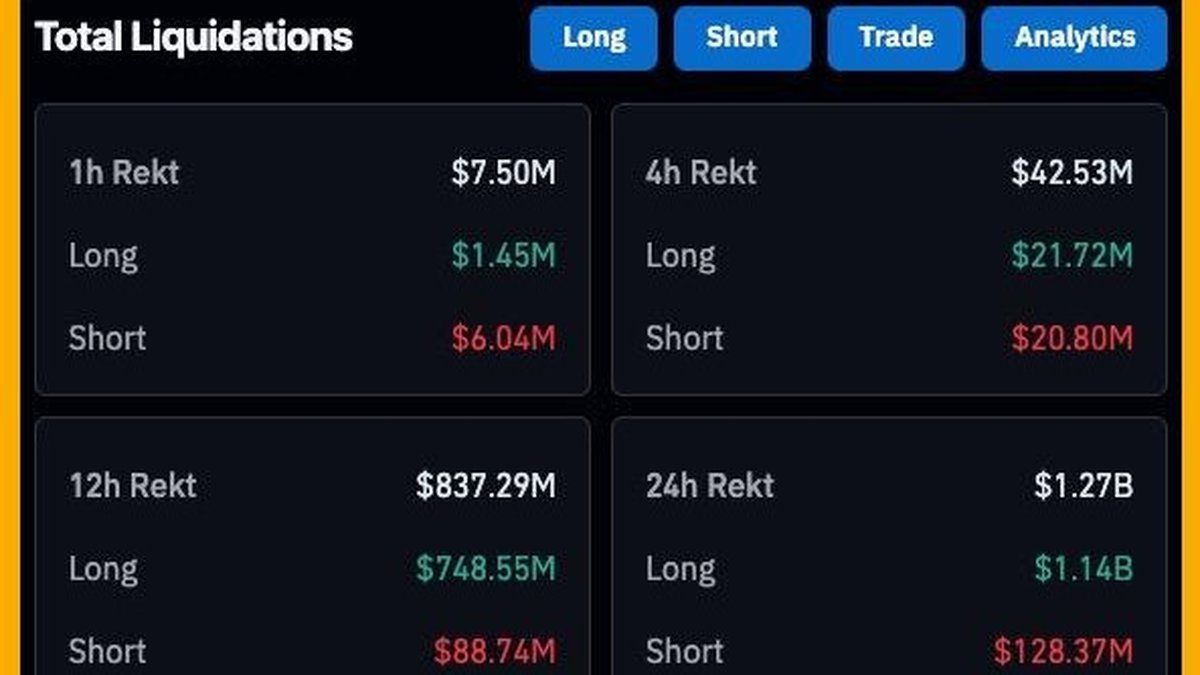
In the past 24 hours, crypto markets delivered a brutal reminder that leverage cuts both ways. Roughly $1.26 billion in positions were forcibly closed as prices slipped, volatility spiked, and risk engines across derivatives venues did what they were designed to do. More than 330,000 accounts got margin calls or liquidations, turning an already tense tape into a cascading deleveraging.
The distribution of pain tells its own story. ETH edged out BTC for the day’s liquidation crown with about $327 million closed, while BTC tallied around $321 million. SOL took third with roughly $155 million, and smaller majors like XRP and DOGE also contributed meaningful sums as over-extended longs were forced to exit. On the venue side, Hyperliquid reported the largest liquidation total at approximately $371 million, followed by Bybit (about $314 million) and Binance (about $247 million). The single biggest blow-up was a BTC/USDT position on HTX worth roughly $33.95 million. Critically, the day was dominated by long liquidations—around $1.13 billion—versus only ~$128.9 million in short positions being closed.
What Triggered the Cascade?
Liquidation waves almost never hinge on a single headline. They’re the end product of positioning, leverage, and liquidity, all interacting in real time. Here’s the short version of the long story:
• Positioning skewed long. Funding and basis metrics had suggested a build-up of bullish exposure across many perps. When markets are top-heavy with longs, even modest dips can snowball as stop-outs and forced selling chase price lower.
• Liquidity was uneven across venues and time zones. Books thin out during off-hours and around macro news windows. When order depth is shallow, a wave of market sells (or forced sells) clears multiple levels quickly, amplifying moves.
• Risk engines are designed to accelerate once thresholds are crossed. As collateral values fall, maintenance margins are breached. Risk systems reduce positions to protect the venue—and the system’s integrity—regardless of a trader’s conviction.
Once the first dominoes fall, the mechanics do the rest: forced sells push price down, which triggers more liquidations, which pushes price down again. That positive feedback loop is why “outlier” days feel vertical on the way down.
Why ETH Outpaced BTC in Notional Liquidations
It’s tempting to assume that Bitcoin should always lead liquidation tables, but where traders take risk matters as much as how much risk they take. In recent weeks, we’ve seen:
• Higher leverage footprints in ETH perps. ETH is a favorite venue for higher-frequency strategies and basis trades, and it attracts speculative flows around roadmap and L2 developments. That often means tighter stops and more leverage per unit of open interest.
• Derivative-led price discovery. When perps lead and spot lags, price can overshoot in both directions as funding and open interest whip around. ETH’s day-to-day trading increasingly reflects this dynamic, particularly during event-heavy periods.
• Cross-asset hedging flows. Traders sometimes hedge alt risk via ETH perps; when alt baskets sell off, the ETH hedge can be lifted in disorderly fashion or, conversely, over-cut, both of which add to ETH’s volatility and liquidation sensitivity.
Exchange Leaderboard: Reading the Microstructure
That Hyperliquid (~$371M) topped the liquidation leaderboard ahead of Bybit (~$314M) and Binance (~$247M) is less about “right or wrong” and more about the composition of each venue’s user base and the plumbing of their risk controls. Venues that attract aggressive retail flow, higher leverage usage, and copy-trading cohorts will naturally show larger liquidation figures during abrupt moves. Conversely, platforms with deeper spot-led liquidity and conservative leverage settings may show smaller absolute numbers even on the same market day.
The day’s largest single liquidation (~$33.95M BTC/USDT on HTX) also highlights another nuance: one large, poorly managed position can distort the tape and accelerate local price gaps. When a big account crosses the maintenance threshold, risk engines liquidate without sympathy. If books are thin, the trade slices through price levels until enough bids absorb it.
Why Longs Took the Hit (and What That Signals)
The imbalance was stark: roughly $1.13B in longs liquidated versus only ~$128.9M in shorts. That tells us a few things:
- Sentiment had turned one-sided. Persistent optimism builds fragility. When everyone leans the same way, there’s nobody left to buy the dip once the dip turns into a slide.
- Stops were too close or non-existent. Many accounts either didn’t use protective stops or placed them just beneath obvious levels. During a rush, those levels get swept—then some.
- Leverage was not sized to realized volatility. If your position sizing assumes “calm seas” and the ocean gets choppy, the math breaks fast.
Importantly, a long-dominated flush is information, not destiny. It says positioning has been reset. Post-wipeout, markets often stabilize or mean-revert simply because there are fewer forced sellers left. But that bounce is not guaranteed; whether it sustains depends on spot demand returning and derivatives heating up in a healthier way (i.e., without immediate funding spikes).
Altcoins: Why SOL, XRP, and DOGE Were Not Spared
With roughly $155M in SOL liquidations and visible pain across XRP and DOGE, the takeaway is simple: when core collateral (BTC, ETH) stumbles, beta gets punished. Alts carry higher implied volatility and lower depth; when perps unwind, spreads widen quickly and slippage explodes. That’s why well-designed risk plans prioritize either smaller sizing in alts or wider, premeditated stops compared with majors.
Spot vs. Perps: Who Drove the Bus?
Spot rarely triggers cascades; it’s usually the passenger. Perps are the driver because they embed leverage and funding incentives. When funding had been persistently positive and prices slipped, the unwind forced long accounts into sells—selling that did not need a human to click any button. That mechanical effect is why cascades can happen in quiet news windows and why they can feel disproportionate to any single headline.
Signs to Watch in the Next 48–72 Hours
After an outsized flush, disciplined traders move from emotion to observation. Here’s your checklist:
1. Open Interest (OI) rebuild versus decay: A controlled, incremental rebuild of OI alongside stable prices is healthier than a sudden snap-back in OI with choppy price (which often precedes another shakeout).
2. Funding normalization: Balanced to mildly positive funding during a rebound is okay; instantly hot funding into resistance is a warning that the bounce is being chased with leverage.
3. Spot leadership: Recoveries with spot-led buying and orderly perp participation tend to hold better than perp-led bounces with weak spot confirmation.
4. Depth on the bid: Post-cascade order books either refill quickly (bullish) or remain patchy (fragile). Watch how bids behave when tested.
Interpreting the Venue Differences (Beyond the Headlines)
Why did Hyperliquid post the largest liquidation tally? Beyond user mix and leverage appetite, think about liquidation mechanics: some venues use partial liquidation tiers and aggressive position reductions; others liquidate more gradually. Different engines produce different prints on fast days. Also, retail-driven venues tend to show higher turnover in momentum names, which magnifies liquidation totals in a down tape.
Professional Playbook: How to Trade the Aftermath
What you do after a liquidation day often matters more than what you did during it. Here’s a framework that scales from cautious to assertive, depending on the signals you observe.
1) Recalibrate Risk Before You Re-Enter
- Lower leverage, at least temporarily. Volatility clusters. Trade smaller size or wider stops so a typical wick doesn’t take you out.
- Use conditional and OCO orders. A plan you can execute automatically will beat improvisation when the tape moves fast.
- Keep liquidation price far from your stop. Don’t let the exchange decide your risk for you.
2) Let Structure Do the Talking
- Wait for acceptance. A single spike is not a trend. Look for multiple closes reclaiming a level that just failed.
- Prefer spot-led turns. If perps rip while spot is sleepy, the bounce is more fragile.
- Sell into the first shelves. After a wipeout, the first resistance bands are where trapped longs often exit; respect them.
3) Hedge or Don’t—But Decide in Advance
- Simple hedges: For larger portfolios, a small BTC or ETH short, or a protective put, can buffer downside during re-entry trials.
- Be honest about complexity. If you don’t actively manage options, keep it simple. Complexity without process is a tax.
Three Scenarios From Here (and How to Respond)
Scenario A: Stabilization and Grind Up
What it looks like: OI rebuilds gradually, funding stays near flat, spot leads modest pushes that hold. Plan: Buy reclaim-and-retest patterns on majors; take partials at nearby supply; let a small runner work with a structure-based trailing stop.
Scenario B: Dead-Cat Bounce Then Another Sweep
What it looks like: Fast perp-led pop, funding spikes, breadth is narrow, and the move fails at the first overhead shelf. Plan: Sell strength into resistance if you are nimble, or simply wait for acceptance before re-engaging. Avoid adding risk into hot funding.
Scenario C: Range and Chop
What it looks like: Price oscillates between the post-liquidation low and the first resistance band; OI and funding meander. Plan: Either switch to range tactics (buy low, sell high, strict stops) or step back until a breakout holds. Chop burns more accounts than crashes.
Lessons From the Wipeout: A Practical Risk Checklist
- Position sizing must be volatility-aware. Size positions off the distance to your stop, not off conviction or recent PnL.
- Stops are tools, not decorations. If you don’t plan to honor them, you’re not managing risk—you’re outsourcing it to the venue.
- Don’t park stops at obvious levels. In a cascade, the market often clears visible liquidity first. Place stops where a structural change invalidates your idea.
- Journal your process. Record entry/exit reasons, funding/OI context, and whether you followed your plan. That feedback loop is how traders actually improve.
Contextualizing the Numbers
| Metric | Figure (Approx.) | Interpretation |
|---|---|---|
| Total liquidations (24h) | $1.26B | System-wide deleveraging event; forced selling drove price action. |
| Accounts affected | >330,000 | Positioning was widespread; not a single-venue anomaly. |
| ETH liquidations | $327M | Leverage concentrated; perp-led price discovery. |
| BTC liquidations | $321M | Even BTC wasn’t spared; underscores systemic nature. |
| SOL liquidations | $155M | High-beta alt sensitivity to major drawdowns. |
| Largest venue | Hyperliquid ($371M) | Retail-heavy leverage and momentum flows amplify totals. |
| Next venues | Bybit ($314M), Binance ($247M) | Major derivatives hubs; deep but not invulnerable books. |
| Biggest single liquidation | HTX BTC/USDT ~$33.95M | Illustrates how one large position can gap local order books. |
| Long liquidations | $1.13B | Positioning skewed long; fragility revealed on first real drawdown. |
| Short liquidations | $128.9M | Comparatively modest; few shorts were leaning aggressively. |
Common Misconceptions After Big Liquidation Days
- “Liquidations cause the drop.” Liquidations are the mechanism, not the initial cause. The initial downtick exposes positioning; liquidations magnify it.
- “It’s all manipulation.” The tape looks predatory when books are thin and stops cluster, but that’s incentive-compatible behavior in any order-driven market. Your edge is to anticipate this structure and manage risk accordingly.
- “Now that everyone’s out, it can only go up.” Deleveraging improves the odds of stability, but spot demand still needs to show up. If it doesn’t, drifting lower remains possible.
Actionable, Not Alarmist
Days like this tempt binary thinking: panic or bravado. Neither helps. Your job is to convert a chaotic tape into a repeatable playbook:
- Respect the information content: the market was too long; it’s now less so.
- Let levels rebuild: demand must prove itself with acceptance above reclaimed shelves.
- Take base hits first: partials into the first resistance pay you for being early and reduce stress.
- Only trail winners when the structure deserves it: higher lows, balanced funding, and spot confirmation.
Final Word
If you woke up to a margin email, the lesson isn’t “never use leverage.” It’s “use leverage as a tool with pre-defined failure points.” If you came through unscathed, avoid victory laps; volatile regimes punish complacency. Whether you are rebuilding after losses or planning the next trade from a position of strength, the principles are the same: size to volatility, place thoughtful stops, and let structure—not emotions—drive your decisions.
Disclaimer
This article is educational in nature and does not constitute financial advice. Trading cryptocurrencies and derivatives involves substantial risk, including the risk of loss. Always conduct your own research, size positions prudently, and use appropriate risk controls.


