1) Golden Cross, properly defined
The Golden Cross is a moving-average event where the shorter trend (commonly the 50-day simple moving average, SMA50) rises through the longer trend (SMA200). Because the 200-day moving average embeds nearly a year of trading sessions, a cross from below says the market’s recent trajectory has improved enough to dominate older price memory. In plain language: demand over the last two months has outweighed the supply conditions of the prior nine months.
Technicians break the signal into three stages:
- Exhaustion and basing: the downtrend weakens; lower lows stop accelerating; volatility compresses; sellers spend effort with little new downside. SMA50 flattens.
- Confirmation: SMA50 curls up and crosses SMA200; price often reclaims prior supply zones and converts them to support. Participation broadens and drawdowns shallow.
- Trend maturation: pullbacks respect the rising SMA50/200 cluster; higher highs and higher lows appear; shallow flags reset momentum rather than end the move.
That clean picture is helpful but incomplete. Moving averages are lagging tools. A cross can occur weeks after the true low; it can also appear late in a run. The professional approach is to treat the Golden Cross as a context signal—a reason to scan for long setups—while waiting for price-action confirmation and healthy positioning before deploying capital.
2) Why markets care about the cross
Two forces make the Golden Cross sticky in practice:
- Behavioral reinforcement: many discretionary and systematic allocators monitor the 200-day. When the short trend climbs above it, mandates that forbid ‘below-200D’ risk begin to relax. The result is incremental bid support around pullbacks.
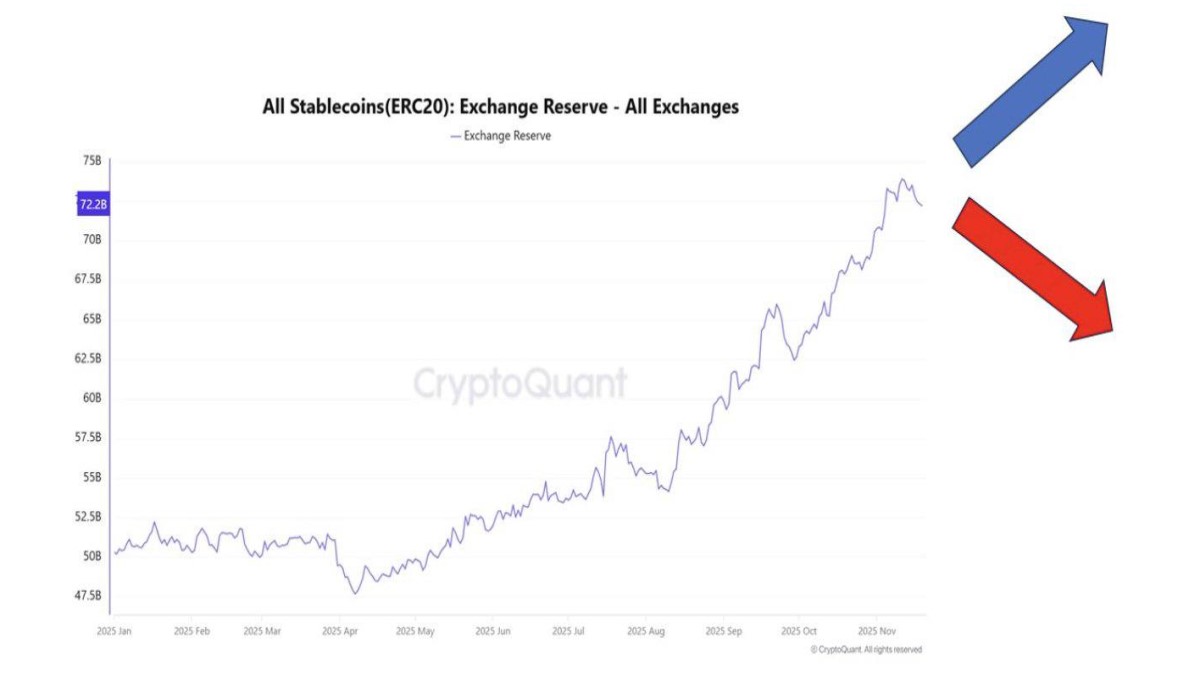
- Structural mechanics: a rising 50D implies recent closes exceed the longer lookback’s mean. That tends to coincide with positive breadth (more uptrending pairs), better spot leadership over perps, and decelerating exchange reserves. Those conditions lower the cost of holding longs.
3) The failure modes most people ignore
Golden Crosses fail for recognizable reasons:
- Flat or falling SMA200: when the long average is sideways or down, crosses are more likely to whipsaw. You want a rising SMA200 and ideally a positive slope acceleration after the cross.
- Overheated leverage: if the cross coincides with crowded longs (elevated funding, stretched basis, surging open interest), the first breakout often gets sold to force de-risking.
- Low volume acceptance: price above both averages without expanding participation is fragile. Healthy trends breathe—we want pullbacks to be quiet and expansions to be loud.
- Macro regime mismatch: cross-asset risk-off periods (liquidity drains, policy shocks) can swamp technically bullish setups. Trend signals are weaker when dollar liquidity is tightening and real yields are spiking.
4) Bitcoin’s current print in context
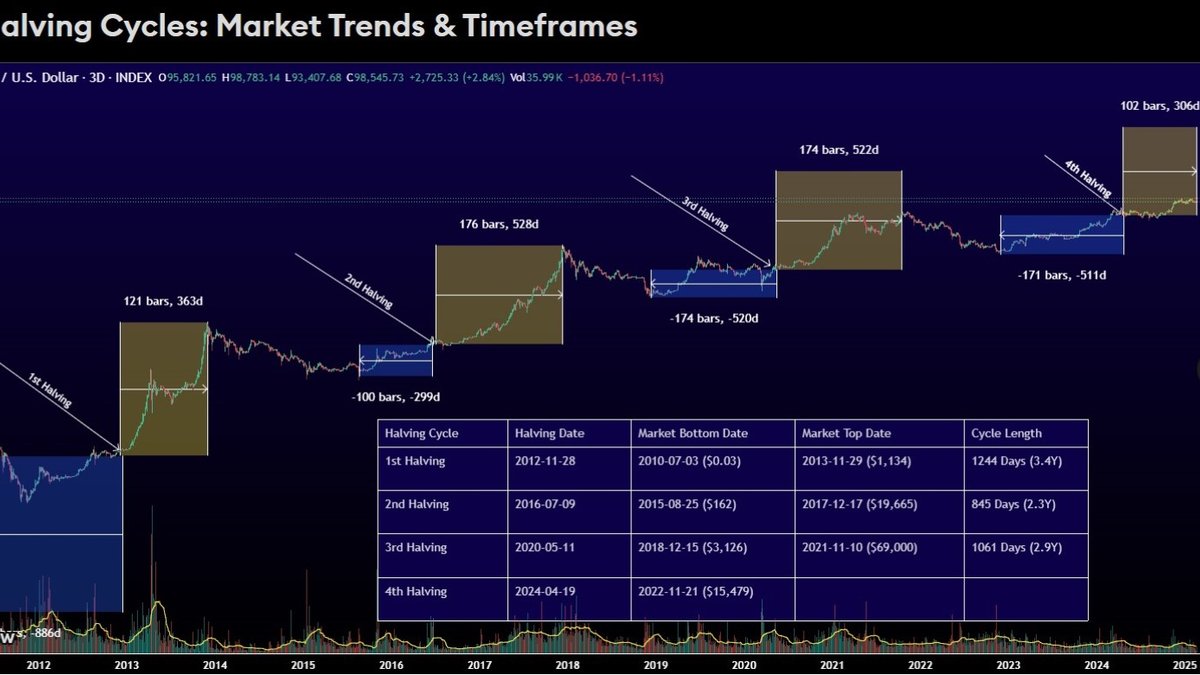
The community is focused on the fourth Golden Cross of the current cycle. The earlier signals are useful benchmarks:
- Post-FTX low (~$16k): after cascading liquidations, BTC based for weeks. The subsequent cross saw price advance rapidly, eventually doubling—a textbook example of stage-three trend maturation.
- Cross around ~$49k: after a consolidation plateau, SMA50 recaptured SMA200. Pullbacks into the 50D held; the 200D turned decisively higher; higher highs followed.
- Cross near ~$76k: arriving later in the trend, this one coincided with choppier breadth. It still resolved higher, but with deeper retracements as leverage oscillated.
- Now near ~$107k: the fresh signal lands after a corrective period and renewed participation from long-horizon buyers. Some desks expect a direct thrust into $140k–$150k (roughly +30% to +40% from the signal zone). Others prefer a pause-then-power path: a test or stall near $120k, a higher low, and then a measured expansion. Both paths are consistent with a valid Golden Cross; the difference is timing and volatility.
Important: the exact price levels of past crosses vary by data source (different exchanges, holiday calendars, or EMA vs. SMA methods). Focus on the behavior: did pullbacks respect the MA cluster? did volume expand on advances? were funding/basis orderly?
5) Quantifying edge without overfitting
Moving-average myths abound. A practical backtest for Bitcoin should:
- Use daily close data, clear rules (enter on close after SMA50 > SMA200 and price above both; exit when SMA50 < SMA200 or when price closes below SMA200 X times).
- Account for transaction costs and slippage (crypto trades 24/7; spreads widen on weekends and event hours).
- Avoid look-ahead bias: compute MAs from historical closes only; no peeking at the future.
- Stress test with EMA variants, HMA, or smoothed WMA and with alternative triggers (e.g., require the 200D slope to be positive).
Across multiple cycles, such tests usually show the Golden Cross underperforms buy-and-hold in runaway bull markets (because of lag) but outperforms on a risk-adjusted basis by avoiding deep bear phases and by defining a clear invalidation. The edge comes from staying long during multi-month expansions while being flat or light when the 50/200 stack inverts.
6) Confirmation framework: how professionals separate signal from story
Our desk uses a five-pillar checklist:
- MA posture: SMA50 > SMA200, both rising, with the 200D’s slope >= 0. If the 200D is flat/negative, we size smaller.
- Breadth: percentage of BTC sectors (L2s, privacy, smart-contract L1s) above their own 50D/200D. Durable BTC trends usually travel with improving breadth.
- Volume & on-chain acceptance: expansions print above 20-session average volume; exchange reserves fall or remain stable; no surge in dormant coins spent (LTH SOPR sub-1 on pullbacks).
- Derivatives sanity: funding near neutral; basis elevated but not euphoric; open interest rising gradually. Crowd heat into resistance is a red flag.
- Level structure: prior supply zones convert to support (close > level, then successful retest). An anchored VWAP from the cross date becomes a useful dynamic line in the sand.
When three or more pillars are green, we treat the Golden Cross as a tradable context, not a Twitter headline.
7) Scenario map and game plans
A) Straight-line extension (probability: ~40%)
Price chews through overhead supply quickly; dips barely test the 20D; SMA50 accelerates above SMA200. Tactics: favor breakout-plus-retest entries, trail below prior 3–5 day lows, and scale out into round-number clusters (120k, 130k, 140k, 150k). Keep leverage modest to survive shakeouts.
B) Stepping-stone advance (probability: ~35%)
BTC stalls around $120k, consolidates in a 10–15% range, prints a higher low, and then expands. Tactics: prefer buy-the-retest of range highs after acceptance; use an anchored VWAP from the breakdown candle inside the range to avoid buying the middle.
C) Cross-then-fade (probability: ~25%)
The cross occurs into crowded longs or macro stress; price undercuts SMA50, revisits SMA200, and may even dip below briefly. Tactics: cut size proactively if the 200D slope flattens and breadth deteriorates; re-engage only after a fresh higher low and a reclaim of the MA cluster.
8) Building trades around the signal
Here is a robust, operational playbook that respects volatility:
- Entry styles: (i) Breakout-retest—after a close above a well-watched shelf (e.g., prior weekly high), buy the first controlled retest that holds on a 4H close; (ii) Pullback-to-MA—buy into the rising SMA50 with tight risk below the last higher low; (iii) VWAP reclaim—use an anchored VWAP from the Golden Cross day; if price sells below and then reclaims it with volume, that’s your trigger.
- Stops: avoid arbitrary percentages; place invalidation beyond structure (under last higher low, below the anchored VWAP, or under SMA200 on a closing basis). On BTC, allow for wick noise—hard stops too tight get harvested.
- Exits: ladder targets at prior supply nodes and round-number magnets. After TP1, promote your stop (beneath the last 4H/1D higher low) so the trade turns from risk-taking to risk-management.
- Position sizing: risk per trade ≤ 0.5–1.0% of equity given BTC’s volatility; if funding turns hot or breadth narrows, cut size by half.
- Timeframe alignment: only add when the lower timeframe (4H) agrees with the higher timeframe (1D). If the 4H prints lower highs while the daily is bullish, patience > entries.
9) Measuring whether momentum is healthy after the cross
Even strong uptrends breathe. We like three lightweight tools to separate healthy resting from distribution:
- Impulses vs. pullbacks: rallies should show longer real bodies and higher volume than pullbacks; pullbacks should be time-based (sideways grind) rather than sharp vertical drops.
- RSI behavior: in bull phases, daily RSI often oscillates between 40–80. Rebounds from 40–50 while price holds above SMA50 are constructive; repeated rejections at 60 with closes below SMA50 warn of trend fatigue.
- CVD and order-book tells: continued price advances with flat or falling cumulative delta suggest passive absorption is handing you higher prices—fine early, suspect late. Late-stage runs should be carried by real buying, not just offer withdrawal.
10) A quick backtest template you can implement
// Pseudocode for a clean SMA50/SMA200 test on BTC daily closes
if (SMA50 > SMA200) and (Slope(SMA200) >= 0) and (Close > SMA200) then
    enter long at close
exit when (SMA50 < SMA200) or (Close < SMA200 for N days) or (max drawdown breach)
position size = risk_budget / (entry - invalidation)
Layer optional filters: require 20-day average volume above its 6-month median; require funding to be within a neutral band; or require breadth > 50% for your BTC-adjacent watchlist. The goal is not to optimize the past but to gate entries in line with present-tense conditions.
11) How to avoid the two most expensive mistakes
Mistake A: treating the Golden Cross as a guarantee. The cross is a probability shift, not a promise. If the 200D is flat or macro conditions are deteriorating, odds are lower—size accordingly. Mistake B: abandoning the plan during the first pullback. Uptrends include scary candles. If invalidation isn’t hit, stick to the method. Moving stops to breakeven too early hands back edge to noise.
12) Linking the signal to macro drivers
Bitcoin’s long-cycle behavior is tethered to liquidity conditions, issuance, and adoption rails. Crosses that occur with rising risk appetite (easing financial conditions, stable real yields) and expanding access (custody, ETF on-ramps, corporate treasury adoption) tend to travel further. Conversely, crosses into liquidity drains or policy shocks often fade before resuming. Keep a dashboard: dollar liquidity proxies, term premia, ETF creations/redemptions, and exchange reserve trends. Use the Golden Cross as the market’s way of saying “momentum is improving”; use the dashboard to assess how far that improvement can carry.
13) Where the 30–40% narrative fits
Why are many traders circling +30% to +40%? Two reasons: (1) on prior valid crosses this cycle, BTC has commonly run multi-week legs of that magnitude before resting; (2) the current structure features relatively thin historical volume above the prior consolidation band, which can produce fast repricing if resistance gives way. That said, a $120k pause is a live scenario because round numbers and prior option strikes attract supply. Both paths fit the Golden Cross playbook; let price and participation choose which one we’re in.
14) A concise, repeatable checklist
- SMA50 > SMA200 and both rising?
- 200D slope positive and accelerating?
- Daily closes holding above reclaimed levels (weekly open, prior range high, anchored VWAP from cross)?
- Expansions on rising volume; pullbacks quiet?
- Funding/basis in a healthy zone; OI rising gradually?
- Breadth improving across BTC-sensitive sectors?
- Defined invalidation and pre-planned partials?
15) Putting it all together
The Golden Cross is less a magic arrow and more a traffic light. It switches from yellow to green, telling you conditions favor trend-following tactics. For Bitcoin’s fourth cross of the cycle, that green light is bright—but the road still has bends. A direct shot toward $140k–$150k is feasible if breadth and spot leadership stick; a detour via $120k before new highs is also consistent with healthy trend development. Whichever route price chooses, your edge will come from process: trade level-to-level, scale out rationally, keep stops where structure says the thesis is wrong, and let time—not tweets—confirm continuation.