Tesla Jumps on Global FSD Update: What the New Software Means for Safety, Adoption, and the Autonomy Race
Tesla shares rallied after the company announced a new iteration of its Full Self-Driving (FSD) software intended for broader global rollout. The upgrade—framed around improved safety, more human-like navigation, and expanded mapping coverage—reignited investor debate about when driver-assistance technology can scale beyond early adopters and how software can reshape the unit economics of automaking. This article unpacks the technical themes behind the update, the regulatory and liability context across regions, the commercial implications for subscriptions and attach rates, and the risk map that could still derail the bullish narrative.
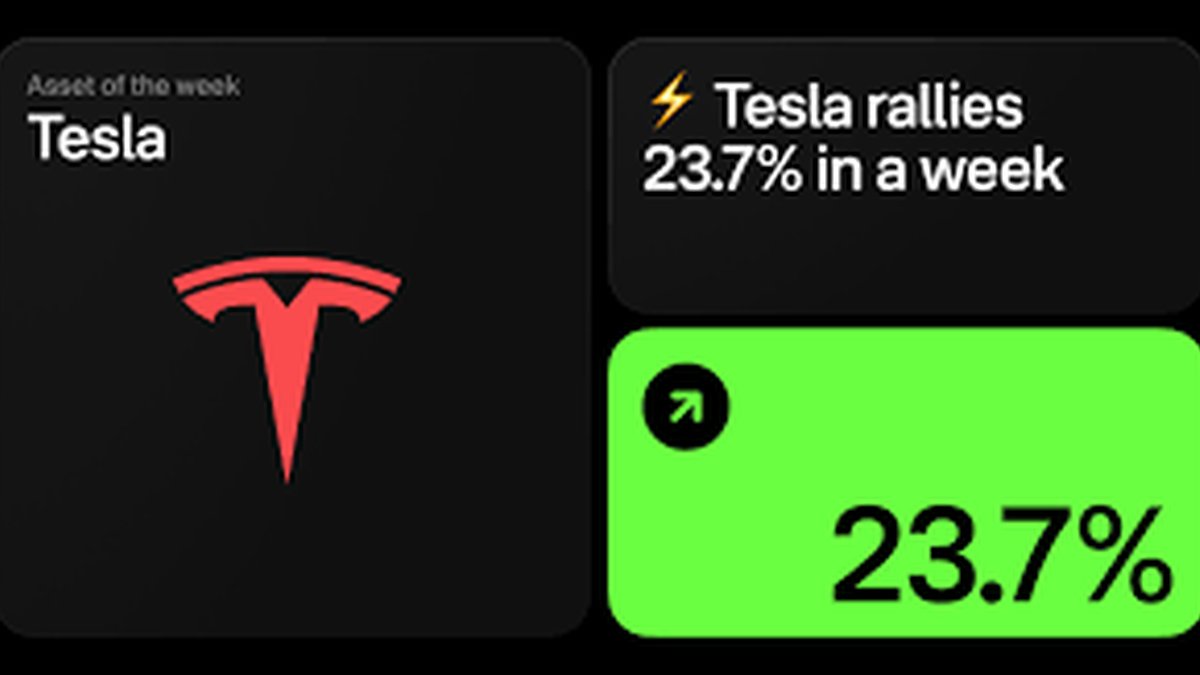
Why the Stock Popped
1) Software Flywheel and Margin Mix
Every meaningful FSD step nudges Tesla closer to a model where software contributes a larger share of gross profit. Whether buyers pay an upfront license or a monthly subscription, recurring software revenue can stack on top of hardware margins and reduce reliance on new-vehicle cycles. If the update meaningfully boosts take rates (the percentage of customers choosing FSD) or retention (the share of subscribers who keep paying), the valuation case for higher multiples becomes clearer.
2) International TAM Expansion
Investors also reacted to the global angle. For years, FSD’s traction has been strongest in North America; broader eligibility in Europe and parts of Asia would enlarge the addressable market and diversify regulatory risk. Even incremental feature parity outside the U.S. can materially lift software adoption if the experience feels consistent.
3) Perception of Execution Momentum
Autonomy has been a long-running promise. Each improvement that reduces interventions, improves path planning, or handles edge cases more gracefully signals operational momentum—across data collection, model training, evaluation, and over-the-air (OTA) deployment. Markets tend to reward visible progress even if full autonomy remains a multi-year journey.
What Likely Changed Under the Hood
End-to-End Learning and Policy Networks
The industry trend—embraced by Tesla—is toward end-to-end neural networks that map sensor inputs directly to driving actions, with intermediate representations for occupancy, lanes, and actor motion. The new build likely advances policy networks that learn human-like behavior: smoother merges, more decisive unprotected turns, and better negotiation in dense urban traffic.
Occupancy & Scene Understanding
Occupancy networks estimate free space and obstacles even when occluded. Improvements here reduce phantom braking and hesitation. Better scene flow—predicting how objects will move—lets the car plan further ahead, interact more naturally with cyclists and pedestrians, and align speed with expected gaps.
Planner Upgrades: From Rules to Preferences
A modern planner weighs safety, efficiency, and comfort. Updates often tune cost functions to penalize abrupt steering, hard braking, or lane ping-ponging. More refined planners can choose routes that minimize complex maneuvers (e.g., fewer unprotected lefts), which reduces intervention probability and improves rider confidence.
Training Data & the Fleet Engine
Tesla’s advantage is data flywheel: billions of real-world miles feed back into training. The new release likely expands autolabeled datasets for rare events—construction detours, temporary signage, emergency vehicles—and improves hard-negative mining (finding examples where prior models failed). OTA telemetry then validates that the new model reduces the same failure classes in the wild.
Safety: What Matters Beyond a Changelog
Driver Supervision Remains Central
Despite the branding, FSD in most markets is a driver-assistance system that requires active human supervision. The new build may further tighten driver monitoring (camera-based attention checks), strengthen fallback behaviors, and document clearer boundaries for when the system disengages. Investor excitement must be tempered by this reality: regulatory approvals and consumer trust hinge on supervised safety today, not promises of full autonomy tomorrow.
Interventions, Disengagements, and Leading Indicators
Key safety KPIs include: miles per intervention; root-cause breakdowns of disengagements (perception vs. planning vs. policy); and post-update regression testing to ensure gains in one scenario don’t degrade performance elsewhere. External safety assessments and insurance outcomes (claim frequency/severity) can corroborate internal metrics over time.
Explainability and Traceability
End-to-end models can be harder to explain. Vendors increasingly pair them with telemetry-first debugging, scenario libraries, and simulation replays. Transparent change logs and third-party audits improve trust—especially crucial when entering new regulatory regimes.
Regulation and Liability Across Regions
United States
Rules focus on driver responsibility for Level 2 systems, with safety investigations, recalls, and state-level variability shaping the landscape. Fleet data sharing, over-the-air recall compliance, and driver-monitoring rigor remain focal points. State laws around autonomous testing differ; consumer features that imply unsupervised operation will attract scrutiny.
Europe
Europe emphasizes type approval, standardized testing, and feature-specific regulation. Automated Lane Keeping and other advanced driver assistance features face explicit performance and HMI (human–machine interface) requirements. Expanding FSD-like capabilities will likely require graduated approvals, geo-fencing for complex scenarios, and robust documentation of driver monitoring.
Asia
Asian markets are heterogeneous. Some jurisdictions encourage innovation through pilot zones and sandbox frameworks; others prioritize conservative rollouts and clear demarcations of driver liability. Localization—language on signs, traffic culture, lane markings, and local road rules—becomes as important as raw model prowess.
Commercial Implications: From Attach Rates to ARPU
Pricing Architecture
Tesla’s revenue levers include upfront license pricing and monthly subscriptions. Global parity in features tends to stabilize willingness to pay. Promotions (free trials, discounted months) can reveal latent demand; the new version creates a fresh opportunity to re-engage trial users who churned under earlier builds.
Insurance and Total Cost of Ownership
If safety metrics trend favorably, insurers may reflect lower risk in premiums, reducing total cost of ownership and indirectly supporting adoption. Conversely, high-profile incidents can swing sentiment and pricing the other way. Integration between telematics and insurance underwriting is an underappreciated unlock for FSD economics.
Resale Value and Fleet Implications
OTA software that improves over time can enhance residual values, benefiting both retail buyers and fleets. For ride-hail or corporate fleets, even supervised autonomy can yield utilization gains on highway-heavy duty cycles—navigation consistency, smoother driving, and lower fatigue.
Competitive Landscape
Robotaxis vs. Consumer ADAS
Some competitors pursue geofenced robotaxis with high-precision maps and restricted domains; others, like Tesla, prioritize consumer-grade systems that aim to generalize across most roads under human supervision. These strategies are complements to the broader autonomy ecosystem but differ in capital needs, regulatory pathways, and monetization.
Sensors and Compute
Hardware choices vary widely—camera-only stacks versus sensor fusion with lidar/radar. Compute roadmaps (in-car NPUs vs. cloud assist) determine how quickly features can grow without blowing up power budgets or bills of materials. For global scale, power efficiency, thermal design, and cost per TOPS matter as much as raw model accuracy.
Data Advantage
Winning at autonomy depends on a data engine: breadth (diverse geographies, weather, road types), depth (corner cases, rare events), and label quality. Tesla’s fleet size and OTA cadence are strengths; sustained leadership requires turning that data into safer policy reliably—and proving it.
Risk Map: What Could Go Wrong
Safety Incidents and Regulatory Response
Isolated incidents can trigger outsized reactions—investigations, software recalls, or feature restrictions. A single sensational event can overshadow aggregate safety improvements, especially if messaging is inconsistent or metrics are opaque.
Liability and Legal Exposure
As capabilities rise, so do expectations. Ambiguous handoff between human and system, unclear driver-monitoring thresholds, or marketing that implies autonomy can create legal risk. Clear disclosures and conservative HMI design help align user behavior with system limits.
Technical Debt and Regressions
Large neural models can regress subtly when optimized for new gains. Without robust gating and shadow-mode testing, improvements in urban navigation might degrade highway behavior, or vice versa. Maintaining multiple regional variants compounds complexity.
Scenarios: Bull, Base, Bear
Bull Case: Adoption Curve Steepens
The update materially cuts interventions in city driving and complex junctions. Driver monitoring is strong, regulators see improved outcomes, and approvals expand. Attach rates and subscriptions rise globally; insurance partners validate lower claims. Tesla’s software ARPU climbs, and the market prices a durable software margin mix.
Base Case: Gradual Progress, Patchwork Expansion
Performance improves, but rollouts remain staged by region and feature. Adoption lifts steadily among tech-forward buyers; mass-market traction requires further gains. Regulators continue cautious approvals tied to data transparency. Shares track cumulative progress with bouts of volatility around headlines.
Bear Case: Safety Setbacks and Policy Friction
High-profile incidents or uneven regional outcomes slow or reverse approvals. Legal challenges raise compliance costs. Technical regressions frustrate users, driving churn and suppressing subscriptions. The equity story reverts to hardware cycles with muted software contribution.
Investor Playbook
KPIs to Watch
- Safety metrics: miles per intervention (by domain), claim frequency/severity trends where telematics inform underwriting.
- Engagement: supervised miles driven with FSD engaged, session length, geographic dispersion.
- Monetization: attach/retention, ARPU by region, trial-to-paid conversion after the update.
- Regulatory cadence: feature parity milestones and documentable compliance upgrades (driver monitoring, HMI).
Positioning Considerations
For growth investors, the thesis centers on software leverage and TAM expansion outside North America. For generalists, risk management argues for balancing enthusiasm over new features with awareness that regulatory and safety headlines can inject sharp drawdowns. Options structures (e.g., call spreads around major software pushes) can cap premium outlay while preserving upside.
Frequently Asked Questions
Is FSD fully autonomous now? In most markets, FSD remains a supervised driver-assistance system (comparable to Level 2/2+). The driver must remain attentive and responsible at all times.
Why do regional rollouts differ? Traffic rules, signage, data-sharing requirements, and type-approval frameworks vary. Localization and regulatory compliance drive staggered releases.
Does camera-only perception limit safety? Any sensor suite has trade-offs. Camera-centric approaches rely on strong vision models and redundancy in policy; sensor-fusion strategies rely on multiple modalities. Outcomes depend on system integration and validation, not sensors alone.
How quickly can software move the needle financially? If attach and retention rise meaningfully, software ARPU can scale within a few quarters. But validation, regulation, and user trust pace the curve.
What would confirm the bullish case? Sustained reductions in interventions across regions, improving insurance outcomes, expanding approvals, and steady subscription growth would validate a durable software margin story.
Bottom Line
Tesla’s latest FSD update matters because it points to progress on three fronts at once: technical capability that feels more natural and confident, regulatory readiness for broader geographies, and commercial potential for higher-margin software revenue. The prize is a business model where recurring software economics compound on top of vehicle sales. The path, however, still runs through supervised safety, transparent metrics, and careful regional execution. If the company turns incremental improvements into globally consistent, regulator-endorsed outcomes, the long-promised autonomy flywheel could finally begin to spin at scale.